Skip directly to site content Skip directly to page options Skip directly to A-Z link Skip directly to A-Z link Skip directly to A-Z link
Volume 25, Number 3—March 2019
Research

Use of Genomics to Investigate Historical Importation of Shiga Toxin–Producing Escherichia coli Serogroup O26 and Nontoxigenic Variants into New Zealand

A. Springer Browne1Comments to Author , Patrick J. Biggs, David A. Wilkinson, Adrian L. Cookson, Anne C. Midwinter, Samuel J. Bloomfield, C. Reed Hranac, Lynn E. Rogers, Jonathan C. Marshall, Jackie Benschop, Helen Withers, Steve Hathaway, Tessy George, Patricia Jaros, Hamid Irshad, Yang Fong, Muriel Dufour, Naveena Karki, Taylor Winkleman, and Nigel P. French
Author affiliations: Massey University, Palmerston North, New Zealand (A.S. Browne, P.J. Biggs, D.A. Wilkinson, A.L. Cookson, A.C. Midwinter, S.J. Bloomfield, C.R. Hranac, L.E. Rogers, J.C. Marshall, J. Benschop, T. George, P. Jaros, H. Irshad, Y. Fong, T. Winkleman, N.P. French); New Zealand Food Safety Science & Research Centre, Palmerston North (D.A. Wilkinson, N.P. French); AgResearch Limited, Palmerston North (A.L. Cookson); Ministry of Primary Industries, Wellington, New Zealand (H. Withers, S. Hathaway); Institute of Environmental Science and Research, Upper Hutt, New Zealand (M. Dufour, N. Karki)

Main Article

Figure 1

Hierarchical set analysis of 404 Escherichia coli serogroup O26 isolates in investigation of historical importation of Shiga toxin–producing E. coli serogroup O26 and nontoxigenic variants into New Zealand, with a hierarchical set RaxML pangenome tree (top of figure) and shared gene groups visualized in green (bottom of figure). This figure illustrates shared gene groups after pangenome analysis. The union portion represents the pangenome relatedness between bacterial isolates. A–E indicate clad

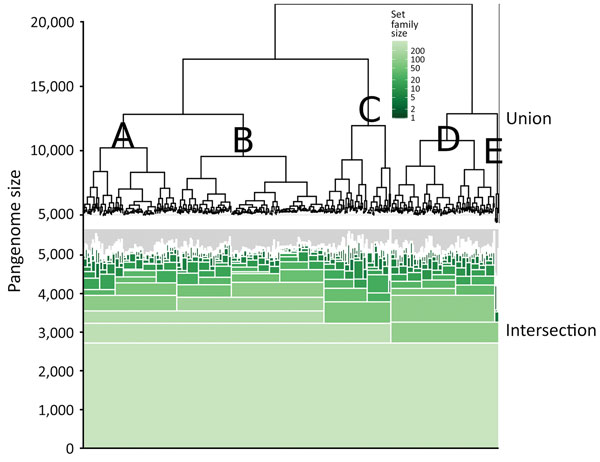
Figure 1. Hierarchical set analysis of 404 Escherichia coli serogroup O26 isolates in investigation of historical importation of Shiga toxin–producing E. coli serogroup O26 and nontoxigenic variants into New Zealand, with a hierarchical set RaxML pangenome tree (top of figure) and shared gene groups visualized in green (bottom of figure). This figure illustrates shared gene groups after pangenome analysis. The union portion represents the pangenome relatedness between bacterial isolates. A–E indicate clades.

Main Article

1Current affiliation: Centers for Disease Control and Prevention, Christiansted, Virgin Islands, USA.

Page created: February 19, 2019
Page updated: February 19, 2019
Page reviewed: February 19, 2019
The conclusions, findings, and opinions expressed by authors contributing to this journal do not necessarily reflect the official position of the U.S. Department of Health and Human Services, the Public Health Service, the Centers for Disease Control and Prevention, or the authors' affiliated institutions. Use of trade names is for identification only and does not imply endorsement by any of the groups named above.
file_external