Volume 25, Number 5—May 2019
Dispatch
Novel Picornavirus in Lambs with Severe Encephalomyelitis
Leonie F. Forth, Sandra F.E. Scholes, Patricia A. Pesavento, Kenneth Jackson, Adrienne Mackintosh, Amanda Carson, Fiona Howie, Kore Schlottau, Kerstin Wernike, Anne Pohlmann, Dirk Höper, and Martin Beer
Figure 2
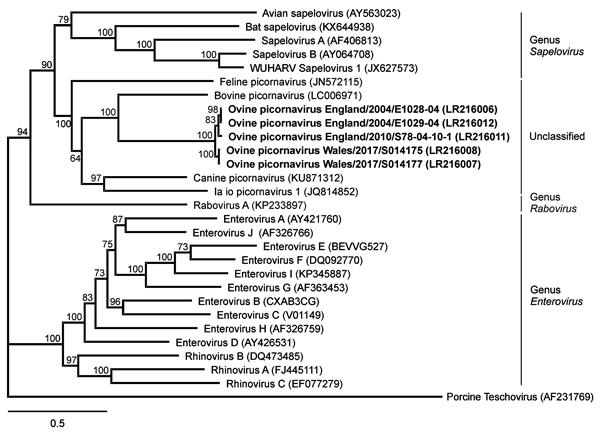
Figure 2. Phylogenetic relation of ovine picornavirus to other picornaviruses of the genera Sapelovirus, Rabovirus, and Enterovirus, as well as unclassified picornaviruses. The maximum-likelihood phylogenetic tree is based on complete coding sequences and calculated by IQ-TREE version 1.6.5 (http://www.iqtree.org) with the best-fit general time reversible plus empirical base frequencies plus free rate model 5. Teschovirus was included as an outgroup. Statistical supports of 100,000 ultrafast bootstraps are indicated at the nodes. Bold indicates sequences generated in this study; INSDC or GenBank accession numbers are provided. Scale bar indicates nucleotide substitutions per site.
Page created: April 18, 2019
Page updated: April 18, 2019
Page reviewed: April 18, 2019
The conclusions, findings, and opinions expressed by authors contributing to this journal do not necessarily reflect the official position of the U.S. Department of Health and Human Services, the Public Health Service, the Centers for Disease Control and Prevention, or the authors' affiliated institutions. Use of trade names is for identification only and does not imply endorsement by any of the groups named above.