Volume 25, Number 6—June 2019
Research
Respiratory Syncytial Virus Seasonality, Beijing, China, 2007–2015
Jianxing Yu1, Chunyan Liu1, Yan Xiao1, Zichun Xiang, Hongli Zhou, Lan Chen, Kunling Shen, Zhengde Xie2, Lili Ren2, and Jianwei Wang2
Figure 4
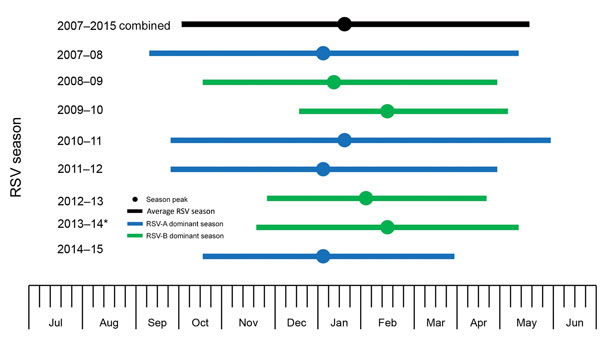
Figure 4. RSV season duration and peak, by year, Beijing, China, July 1, 2007–June 30, 2015. RSV season was defined as consecutive weeks during which the percentage of RSV-specific PCRs testing positive per week exceeded a 10% threshold. Graph begins at calendar week 27. *We assigned 2013–14 as an RSV-B–dominant season for modeling purposes, although almost equal numbers of RSV-A and RSV-B were identified that season. RSV, respiratory syncytial virus; RSV-A, RSV subgroup A; RSV-B, RSV subgroup B.
1These authors contributed equally to this article.
2These senior authors contributed equally to this article.
Page created: May 20, 2019
Page updated: May 20, 2019
Page reviewed: May 20, 2019
The conclusions, findings, and opinions expressed by authors contributing to this journal do not necessarily reflect the official position of the U.S. Department of Health and Human Services, the Public Health Service, the Centers for Disease Control and Prevention, or the authors' affiliated institutions. Use of trade names is for identification only and does not imply endorsement by any of the groups named above.