Volume 25, Number 6—June 2019
Research
Sequential Emergence and Wide Spread of Neutralization Escape Middle East Respiratory Syndrome Coronavirus Mutants, South Korea, 2015
Figure 2

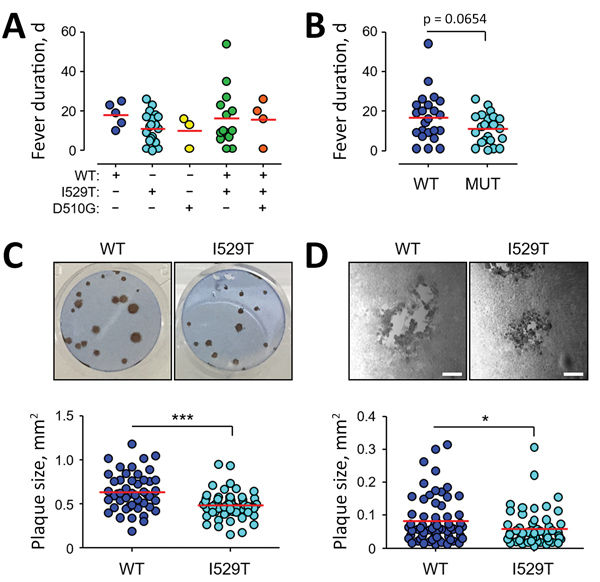
Figure 2. Effect of spike mutations in Middle East respiratory syndrome coronavirus (MERS-CoV) on fever duration and virus growth in vitro during the 2015 outbreak in South Korea. A) Fever duration of 48 patients for whom virus spike sequence information is available are presented depending on the associated spike genotypes. B) Fever duration of patient group associated with WT virus, including mixed infection (n = 23) and those infected only with either of the mutant viruses (n = 25). Mean value of each group is indicated by red lines. Baseline information of the patients and their associated MERS-CoV spike sequences are summarized in online Appendix Table 1. C and D) Distribution of viral plaque sizes in Vero cells (panel C: WT, n = 48; I529T, n = 58) or 293T–CD26 cells (panel D: WT, n = 65; I529T, n = 55) infected with MERS-CoV bearing WT or I529T mutant spike at 3 days after infection. Representative results of plaque assay are presented in the upper panels, and size distribution of viral plaques are plotted in the lower panel. Mean values are indicated by red lines. Significance was calculated by using a 2-tailed student’s t-test. WT, wild-type. ***p<0.001, *p<0.05. Scale bar indicates 100 μm.
1These first authors contributed equally to this article.
2These authors were co-principal investigators.