Skip directly to site content Skip directly to page options Skip directly to A-Z link Skip directly to A-Z link Skip directly to A-Z link
Volume 25, Number 7—July 2019
CME ACTIVITY - Synopsis

Prescribing Patterns for Treatment of Mycobacterium avium Complex and M. xenopi Pulmonary Disease in Ontario, Canada, 2001–2013

Sarah K. BrodeComments to Author , Hannah Chung, Michael A. Campitelli, Jeffrey C. Kwong, Alex Marchand-Austin, Kevin L. Winthrop, Frances B. Jamieson, and Theodore K. Marras
Author affiliations: West Park Healthcare Centre, Toronto, Ontario, Canada (S.K. Brode); ICES, Toronto (S.K. Brode, H. Chung, M.A. Campitelli, J.C. Kwong); University of Toronto, Toronto (S.K. Brode, J.C. Kwong, F.B. Jamieson, T.K. Marras); University Health Network and Sinai Health System, Toronto (S.K. Brode, T.K. Marras); Toronto Western Family Health Team, Toronto (J.C. Kwong); Public Health Ontario, Toronto (J.C. Kwong, A. Marchand-Austin, F.B. Jamieson); Oregon Health and Science University, Portland, Oregon, USA (K.L. Winthrop)

Main Article

Figure

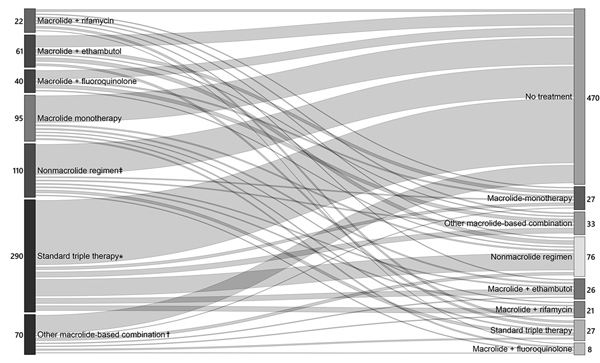
Flow of therapy for 688 patients with Mycobacterium avium complex pulmonary disease, depicting transition between first and second regimens during first 18 months of treatment, Ontario, Canada, 2001–2013. Values are the number of patients receiving each treatment regimen in each epoch of therapy. An epoch is defined as >60 days of the therapy. The width of the lines is proportional to the number of patients receiving and transitioning between each regimen. Mean (± SD) duration of treatment, i

Figure. Flow of therapy for 688 patients with Mycobacterium avium complex pulmonary disease, depicting transition between first and second regimens during first 18 months of treatment, Ontario, Canada, 2001–2013. Values are the number of patients receiving each treatment regimen in each epoch of therapy. An epoch is defined as >60 days of the therapy. The width of the lines is proportional to the number of patients receiving and transitioning between each regimen. Mean (± SD) duration of treatment, in days, for each starting regimen is as follows: standard triple therapy 315 (± 167), other macrolide containing combination 331 (± 157), macrolide-ethambutol 274 (± 172), macrolide monotherapy 230 (±167), nonmacrolide containing regimen 176 (± 178), macrolide-fluoroquinolone 216 (± 147), macrolide-rifamycin 197 (± 139). *Macrolide, ethambutol, and a rifamycin, ± other drugs; †macrolide + >2 additional drugs (other than standard triple therapy); ‡ethambutol, a rifamycin, or fluoroquinolone, either alone or in combination.

Main Article

Page created: June 17, 2019
Page updated: June 17, 2019
Page reviewed: June 17, 2019
The conclusions, findings, and opinions expressed by authors contributing to this journal do not necessarily reflect the official position of the U.S. Department of Health and Human Services, the Public Health Service, the Centers for Disease Control and Prevention, or the authors' affiliated institutions. Use of trade names is for identification only and does not imply endorsement by any of the groups named above.
file_external