High Pathogenicity of Nipah Virus from Pteropus lylei Fruit Bats, Cambodia
Maria Gaudino, Noémie Aurine, Claire Dumont, Julien Fouret, Marion Ferren, Cyrille Mathieu, Olivier Reynard, Viktor E. Volchkov, Catherine Legras-Lachuer, Marie-Claude Georges-Courbot, and Branka Horvat

Author affiliations: Centre International de Recherche en Infectiologie, CIRI, INSERM U1111, CNRS, UMR5308, Univ Lyon, University Claude Bernard Lyon 1, École Normale Supérieure de Lyon, Lyon, France (M. Gaudino, N. Aurine, C. Dumont, J. Fouret, M. Ferren, C. Mathieu, O. Reynard, V.E. Volchkov, M.-C. Georges-Courbot, B. Horvat); ViroScan 3D, Trévoux, France (J. Fouret, C. Legras-Lachuer); University Claude Bernard Lyon 1, LEM, UMR5557, CNRS, INRA, VetAgro Sup, Lyon (C. Legras-Lachuer); Unité de Biologie des Infections Virales Emergentes, Institut Pasteur, INSERM P4, Jean Mérieux, Lyon (M.-C. Georges-Courbot)
Main Article
Figure 1
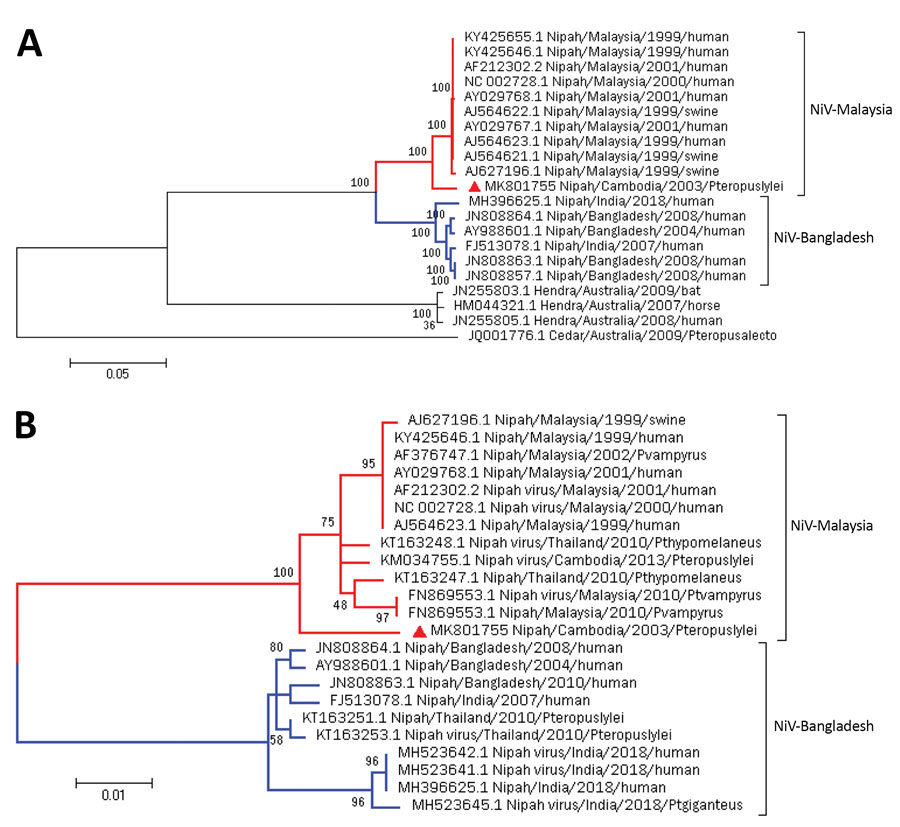
Figure 1. Maximum-likelihood phylogenetic analysis of NiV CSUR381, Cambodia, 2003 (red triangle), compared with other henipaviruses and NiVs. A) Phylogenetic tree constructed with complete genome sequences. A general time-reversible model was calculated as the best DNA model to conduct this analysis. B) Phylogenetic tree constructed by using the nucleocapsid gene. The Kimura 2-parameter model was calculated as the best DNA model to conduct this analysis. Bootstrap statistical support is marked on branch nodes. GenBank accession numbers of isolates are provided in branches, and NiV lineages of isolates are indicated. Phylogenetic trees are drawn to scale; scale bars represent branch lengths measured in the number of substitutions per site. NiV, Nipah virus.
Main Article
Page created: December 18, 2019
Page updated: December 18, 2019
Page reviewed: December 18, 2019
The conclusions, findings, and opinions expressed by authors contributing to this journal do not necessarily reflect the official position of the U.S. Department of Health and Human Services, the Public Health Service, the Centers for Disease Control and Prevention, or the authors' affiliated institutions. Use of trade names is for identification only and does not imply endorsement by any of the groups named above.