Volume 26, Number 10—October 2020
Research
Impact of Social Distancing Measures on Coronavirus Disease Healthcare Demand, Central Texas, USA
Figure 1
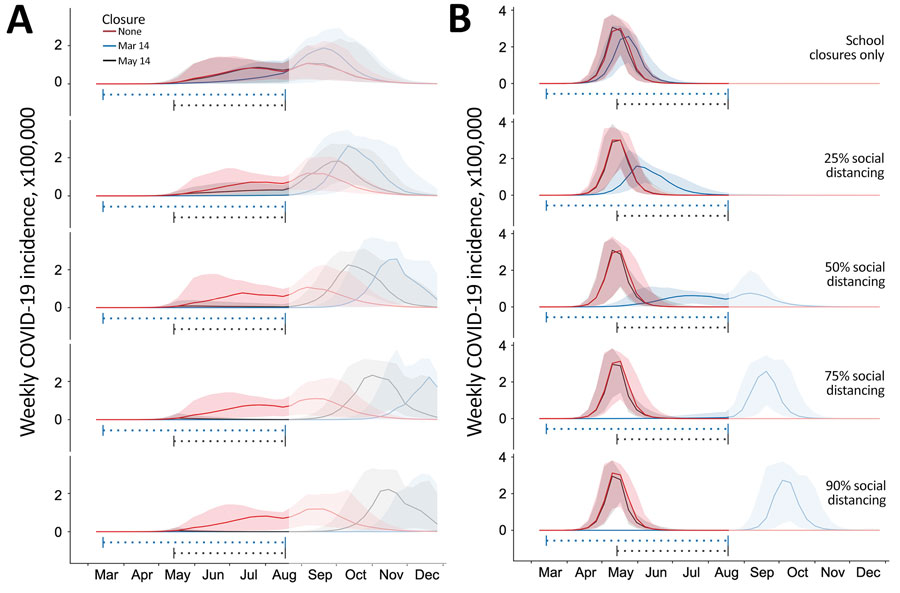
Figure 1. Projected weekly incident of COVID-19 cases in Austin–Round Rock Metropolitan Statistical Area, Texas, USA. Graphs show simulation results for different levels of social distancing and implementation times, assuming an epidemic doubling time of A) 7.2 days (18–20,22) or B) 4 days (22–24). Each graph displays 3 projections: a baseline assuming no social distancing (red), social distancing implemented March 14–Aug 17, 2020 (blue), and social distancing implemented May 14–Aug 17, 2020 (black). From top to bottom, the graphs in each column correspond to increasingly stringent social distancing measures: school closures plus social distancing that reduces nonhousehold contacts by 0%, 25%, 50%, 75%, or 90%. Solid lines indicate medians of 100 stochastic simulations; shading indicates inner 95% ranges of values. The horizontal dotted lines beneath the curves indicate intervention periods. The faded mid-August to December time range indicates long-range uncertainty regarding COVID-19 transmission dynamics and intervention policies. COVID-19, coronavirus disease.
References
- The Washington Post. WHO declares a pandemic of coronavirus disease COVID-19, 2020 Mar 11 [cited 2020 Mar 25]. https://www.washingtonpost.com/health/2020/03/11/who-declares-pandemic-coronavirus-disease-covid-19
- World Health Organization. Novel coronavirus (2019-nCoV) situation reports [cited 2020 Mar 30]. https://www.who.int/emergencies/diseases/novel-coronavirus-2019/situation-reports
- Holshue ML, DeBolt C, Lindquist S, Lofy KH, Wiesman J, Bruce H, et al.; Washington State 2019-nCoV Case Investigation Team. First case of 2019 novel coronavirus in the United States. N Engl J Med. 2020;382:929–36. DOIPubMedGoogle Scholar
- Wheeler I. Orange County coronavirus patient released, in good condition, health officials say. Orange County Register. Orange County Register. 2020 Feb 4 [cited 2020 Mar 26]. https://www.ocregister.com/risk-of-catching-coronavirus-in-so-cal-is-low-health-officials-say
- Goldstein J, McKinley J. Second case of coronavirus in N.Y. sets off search for others exposed. The New York Times. 2020 Mar 3 [cited 2020 Mar 26]. https://www.nytimes.com/2020/03/03/nyregion/coronavirus-new-york-state.html
- Centers for Disease Control and Prevention. Coronavirus 2019; 2020 [cited 2020 Mar 25]. https://www.cdc.gov/media/releases/2020/t0228-COVID-19-update.html
- Centers for Disease Control and Prevention. Coronavirus disease 2019 (COVID-19) in the US; 2020 [cited 2020 Mar 25]. https://www.cdc.gov/coronavirus/2019-ncov/cases-updates/cases-in-us.html
- Koenig D. NYC hospitals struggle with coronavirus surge. WebMD. 2020 [cited 2020 Mar 28]. https://www.webmd.com/lung/news/20200326/nyc-hospitals-struggle-with-coronavirus-surge
- Bush E, Gilbert D. Short-staffed and undersupplied: coronavirus crisis strains Seattle area’s capacity to deliver care. The Seattle Times. 2020 Mar 12 [cited 2020 Mar 28]. https://www.seattletimes.com/seattle-news/health/short-staffed-and-undersupplied-coronavirus-crisis-strains-seattle-areas-capacity-to-deliver-care
- Mervosh S, Lu D, Swales V. See which states and cities have told residents to stay at home. The New York Times, 2020 Mar 24 [cited 2020 Mar 28]. https://www.nytimes.com/interactive/2020/us/coronavirus-stay-at-home-order.html
- Adeline S, Jin CH, Hurt A, Wilburn T, Wood D, Talbot R. Tracking the pandemic: are coronavirus cases rising or falling in your state? NPR. 2020 Jun 25 [cited 2020 Jun 25]. https://www.npr.org/sections/health-shots/2020/03/16/816707182/map-tracking-the-spread-of-the-coronavirus-in-the-u-s
- US Census Bureau. American Community Survey (ACS) [cited 2019 Nov 19]. https://www.census.gov/programs-surveys/acs
- Centers for Disease Control and Prevention. 500 cities project: Local data for better health; 2019 [cited 2020 Mar 19]. https://www.cdc.gov/500cities/index.htm
- Centers for Disease Control and Prevention. HIV surveillance report, 2016. 2017 Nov [cited 2020 Jul 8]. https://www.cdc.gov/hiv/library/reports/hiv-surveillance.html
- Morgan OW, Bramley A, Fowlkes A, Freedman DS, Taylor TH, Gargiullo P, et al. Morbid obesity as a risk factor for hospitalization and death due to 2009 pandemic influenza A(H1N1) disease. [Internet]. PLoS One. 2010;5:
e9694 . DOIPubMedGoogle Scholar - Sturm R, Hattori A. Morbid obesity rates continue to rise rapidly in the United States. Int J Obes. 2013;37:889–91. DOIPubMedGoogle Scholar
- Centers for Disease Control and Prevention. Estimating the number of pregnant women in a geographic area. Division of Reproductive Health [cited 2020 Jul 8]. https://www.cdc.gov/reproductivehealth/emergency/pdfs/PregnacyEstimatoBrochure508.pdf
- Du Z, Xu X, Wu Y, Wang L, Cowling BJ, Meyers LA. Serial interval of COVID-19 among publicly reported confirmed cases. Emerg Infect Dis. 2020;26:1341–3. DOIPubMedGoogle Scholar
- Li Q, Guan X, Wu P, Wang X, Zhou L, Tong Y, et al. Early transmission dynamics in Wuhan, China, of novel coronavirus-infected pneumonia. N Engl J Med. 2020;382:1199–207. DOIPubMedGoogle Scholar
- Wu JT, Leung K, Leung GM. Nowcasting and forecasting the potential domestic and international spread of the 2019-nCoV outbreak originating in Wuhan, China: a modelling study. Lancet. 2020;395:689–97. DOIPubMedGoogle Scholar
- Du Z, Wang L, Cauchemez S, Xu X, Wang X, Cowling BJ, et al. Risk for transportation of coronavirus disease from Wuhan to other cities in China. Emerg Infect Dis. 2020;26:1049–52. DOIPubMedGoogle Scholar
- Kraemer MUG, Yang C-H, Gutierrez B, Wu C-H, Klein B, Pigott DM, et al.; Open COVID-19 Data Working Group. The effect of human mobility and control measures on the COVID-19 epidemic in China. Science. 2020;368:493–7. DOIPubMedGoogle Scholar
- Muniz-Rodriguez K, Chowell G, Cheung C-H, Jia D, Lai P-Y, Lee Y, et al. Doubling time of the COVID-19 epidemic by province, China. Emerg Infect Dis. 2020;26:1912–4; Epub ahead of print. DOIPubMedGoogle Scholar
- Roser M, Ritchie H, Ortiz-Ospina E. Coronavirus disease (COVID-19): statistics and research. Our world in data, 2020 [cited 2020 Jul 8]. https://ourworldindata.org/coronavirus?fbclid=IwAR2qRdLFRmugoD0w_r13O4HAOHrL1hiHfduyB2XvtXNjtQ5GGW6Dg9EsIZA
- Prem K, Cook AR, Jit M. Projecting social contact matrices in 152 countries using contact surveys and demographic data. PLOS Comput Biol. 2017;13:
e1005697 . DOIPubMedGoogle Scholar - Zhang J, Litvinova M, Wang W, Wang Y, Deng X, Chen X, et al. Evolving epidemiology and transmission dynamics of coronavirus disease 2019 outside Hubei province, China: a descriptive and modelling study. Lancet Infect Dis. 2020;20:793–802. DOIPubMedGoogle Scholar
- He X, Lau EHY, Wu P, Deng X, Wang J, Hao X, et al. Temporal dynamics in viral shedding and transmissibility of COVID-19. Nat Med. 2020;26:672–5. DOIPubMedGoogle Scholar
- He D, Zhao S, Lin Q, Zhuang Z, Cao P, Wang MH, et al. The relative transmissibility of asymptomatic COVID-19 infections among close contacts. Int J Infect Dis. 2020;94:145–7. DOIPubMedGoogle Scholar
- Gudbjartsson DF, Helgason A, Jonsson H, Magnusson OT, Melsted P, Norddahl GL, et al. Spread of SARS-CoV-2 in the Icelandic population. N Engl J Med. 2020;382:2302–15. DOIPubMedGoogle Scholar
- Mossong J, Hens N, Jit M, Beutels P, Auranen K, Mikolajczyk R, et al. Social contacts and mixing patterns relevant to the spread of infectious diseases. PLoS Med. 2008;5:
e74 . DOIPubMedGoogle Scholar - United Nations. Record view: population by age, sex and urban/rural residence [cited 2020 Mar 22]. http://data.un.org/Data.aspx?d=POP&f=tableCode%3a22
- Siegel E. Why “exponential growth” is so scary for the COVID-19 coronavirus. Forbes Magazine, 2020 Mar 17 [cited 2020 Mar 30]. https://www.forbes.com/sites/startswithabang/2020/03/17/why-exponential-growth-is-so-scary-for-the-covid-19-coronavirus
- Austin Independent School District. Calendar of events, 2020 [cited 2020 Mar 26]. https://www.austinisd.org/calendar
- Ferguson NM, Laydon D, Nedjati-Gilani G, Imai N, Ainslie K, Baguelin M, et al. Impact of non-pharmaceutical interventions (NPIs) to reduce COVID-19 mortality and healthcare demand, 2020. Imperial College London. 2020 [cited 2020 Jul 8]. https://sciencebusiness.net/sites/default/files/inline-files/Imperial-College-COVID19-NPI-modelling-16-03-2020.pdf
- SXSW. Facts, figures & quotes. SXSW Conference & Festivals [cited 2020 Mar 25]. https://www.sxsw.com/facts-figures-quotes
- Austin Independent School District. Important message. 2020 Mar 13 [cited 2020 Mar 26]. https://www.austinisd.org/announcements/2020/03/13/important-message-mensaje-importante
- The University of Texas at Austin. COVID-19 updates. Guidance related to the coronavirus disease, 2020 [cited 2020 Mar 26]. https://coronavirus.utexas.edu/all-campus-communications-covid-19
- City of Austin, Texas. Coronavirus disease. 2019 (COVID-19) [cited 2020 Mar 25]. http://www.austintexas.gov/COVID19
- University of Texas News. A new Texas COVID-19 pandemic toolkit shows the importance of social distancing. 2020 Mar 26 [cited 2020 Mar 28]. https://news.utexas.edu/2020/03/26/a-new-texas-covid-19-pandemic-toolkit-shows-the-importance-of-social-distancing
- Chen Q, Liang M, Li Y, Guo J, Fei D, Wang L, et al. Mental health care for medical staff in China during the COVID-19 outbreak. Lancet Psychiatry. 2020;7:e15–6. DOIPubMedGoogle Scholar
- Maharaj S, Kleczkowski A. Controlling epidemic spread by social distancing: do it well or not at all. BMC Public Health. 2012;12:679. DOIPubMedGoogle Scholar
- Lempel H, Epstein JM, Hammond RA. Economic cost and health care workforce effects of school closures in the U.S. PLoS Curr. 2009;1:
RRN1051 . DOIPubMedGoogle Scholar - Araz OM, Damien P, Paltiel DA, Burke S, van de Geijn B, Galvani A, et al. Simulating school closure policies for cost effective pandemic decision making. BMC Public Health. 2012;12:449. DOIPubMedGoogle Scholar
- Guan W-J, Ni Z-Y, Hu Y, Liang W-H, Ou C-Q, He J-X, et al.; China Medical Treatment Expert Group for Covid-19. Clinical characteristics of coronavirus disease 2019 in China. N Engl J Med. 2020;382:1708–20. DOIPubMedGoogle Scholar
- Verity R, Okell LC, Dorigatti I, Winskill P, Whittaker C, Imai N, et al. Estimates of the severity of coronavirus disease 2019: a model-based analysis. Lancet Infect Dis. 2020;20:669–77. DOIPubMedGoogle Scholar
- Liu W, Zhang Q, Chen J, Xiang R, Song H, Shu S, et al. Detection of COVID-19 in children in early January 2020 in Wuhan, China. N Engl J Med. 2020;382:1370–1. DOIPubMedGoogle Scholar
- Hoen AG, Hladish TJ, Eggo RM, Lenczner M, Brownstein JS, Meyers LA. Epidemic wave dynamics attributable to urban community structure: a theoretical characterization of disease transmission in a large network. J Med Internet Res. 2015;17:
e169 . DOIPubMedGoogle Scholar - Meyers LA, Pourbohloul B, Newman ME, Skowronski DM, Brunham RC. Network theory and SARS: predicting outbreak diversity. J Theor Biol. 2005;232:71–81. DOIPubMedGoogle Scholar
- Volz EM, Miller JC, Galvani A, Ancel Meyers L. Effects of heterogeneous and clustered contact patterns on infectious disease dynamics. PLOS Comput Biol. 2011;7:
e1002042 . DOIPubMedGoogle Scholar - Long Q-X, Tang X-J, Shi Q-L, Li Q, Deng H-J, Yuan J, et al. Clinical and immunological assessment of asymptomatic SARS-CoV-2 infections. Nat Med. 2020;Jun 18 {Epub ahead of print].DOIPubMedGoogle Scholar
1These authors contributed equally to this article.