Skip directly to site content Skip directly to page options Skip directly to A-Z link Skip directly to A-Z link Skip directly to A-Z link
Volume 26, Number 10—October 2020
Research

Impact of Social Distancing Measures on Coronavirus Disease Healthcare Demand, Central Texas, USA

Xutong Wang1, Remy F. Pasco1, Zhanwei Du1, Michaela Petty, Spencer J. Fox, Alison P. Galvani, Michael Pignone, S. Claiborne Johnston, and Lauren Ancel MeyersComments to Author 
Author affiliations: The University of Texas at Austin, Austin, Texas, USA (X. Wang, R.F Pasco, Z. Du, M. Petty, S.J. Fox, L. Ancel Meyers); Yale University School of Public Health, New Haven, Connecticut, USA (A.P. Galvani); The University of Texas at Austin Dell Medical School, Austin (M. Pignone, S. Claiborne Johnston); Santa Fe Institute, Santa Fe, New Mexico, USA (L. Ancel Meyers)

Main Article

Figure 2

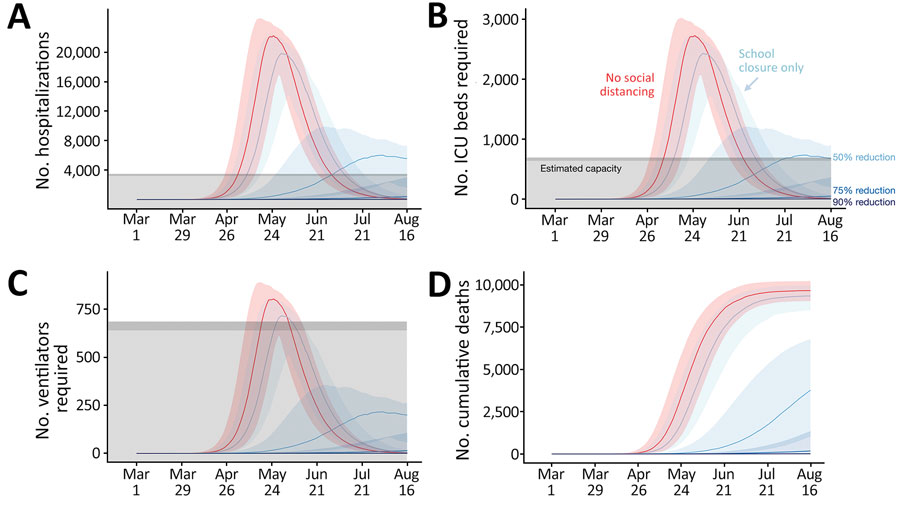
Projected COVID-19 healthcare demand and cumulative deaths in Austin–Round Rock Metropolitan Statistical Area, Texas, USA. Graphs show simulation results across multiple levels of social distancing, assuming a basic reproductive number of 2.2 with a 4-day epidemic doubling time. Extensive social distancing is expected to substantially reduce the burden of COVID-19 A) hospitalizations, B) patients requiring ICU care, C) patients requiring mechanical ventilation, and D) cumulative deaths. Red line

Figure 2. Projected COVID-19 healthcare demand and cumulative deaths in Austin–Round Rock Metropolitan Statistical Area, Texas, USA. Graphs show simulation results across multiple levels of social distancing, assuming a basic reproductive number of 2.2 with a 4-day epidemic doubling time. Extensive social distancing is expected to substantially reduce the burden of COVID-19 A) hospitalizations, B) patients requiring ICU care, C) patients requiring mechanical ventilation, and D) cumulative deaths. Red lines indicate projected COVID-19 transmission assuming no interventions under the parameters given in Table A1. Blue lines indicate increasing levels of social distancing interventions, from light to dark: school closures plus social distancing interventions that reduce nonhousehold contacts by either 0%, 50%, 75%, or 90%. Lines and shading indicate medians and inner 95% ranges of values across 100 stochastic simulations. Gray shaded region indicates estimated surge capacity for COVID-19 patients in the Austin-Round Rock Metropolitan Statistical Area as of March 28, 2020, which is calculated on the basis of 80% of the total 4,299 hospital beds, 90% of the total 755 ICU beds, and 755 mechanical ventilators. COVID-19, coronavirus disease; ICU, intensive care unit.

Main Article

1These authors contributed equally to this article.

Page created: July 08, 2020
Page updated: September 17, 2020
Page reviewed: September 17, 2020
The conclusions, findings, and opinions expressed by authors contributing to this journal do not necessarily reflect the official position of the U.S. Department of Health and Human Services, the Public Health Service, the Centers for Disease Control and Prevention, or the authors' affiliated institutions. Use of trade names is for identification only and does not imply endorsement by any of the groups named above.
file_external