Skip directly to site content Skip directly to page options Skip directly to A-Z link Skip directly to A-Z link Skip directly to A-Z link
Volume 26, Number 12—December 2020
Research Letter

Effects of Cocooning on Coronavirus Disease Rates after Relaxing Social Distancing

Xutong Wang, Zhanwei Du, George Huang, Remy F. Pasco, Spencer J. Fox, Alison P. Galvani, Michael Pignone, S. Claiborne Johnston, and Lauren Ancel MeyersComments to Author 
Author affiliations: The University of Texas at Austin, Austin, Texas, USA (X. Wang, Z. Du, G. Huang, R.F. Pasco, S.J. Fox, L.A. Meyers); Yale School of Public Health, New Haven, Connecticut, USA (A.P. Galvani); T; he University of Texas at Austin Dell Medical School, Austin (M. Pignone, S. Claiborne Johnston); Santa Fe Institute, Santa Fe, New Mexico, USA (L. Ancel Meyers)

Main Article

Figure

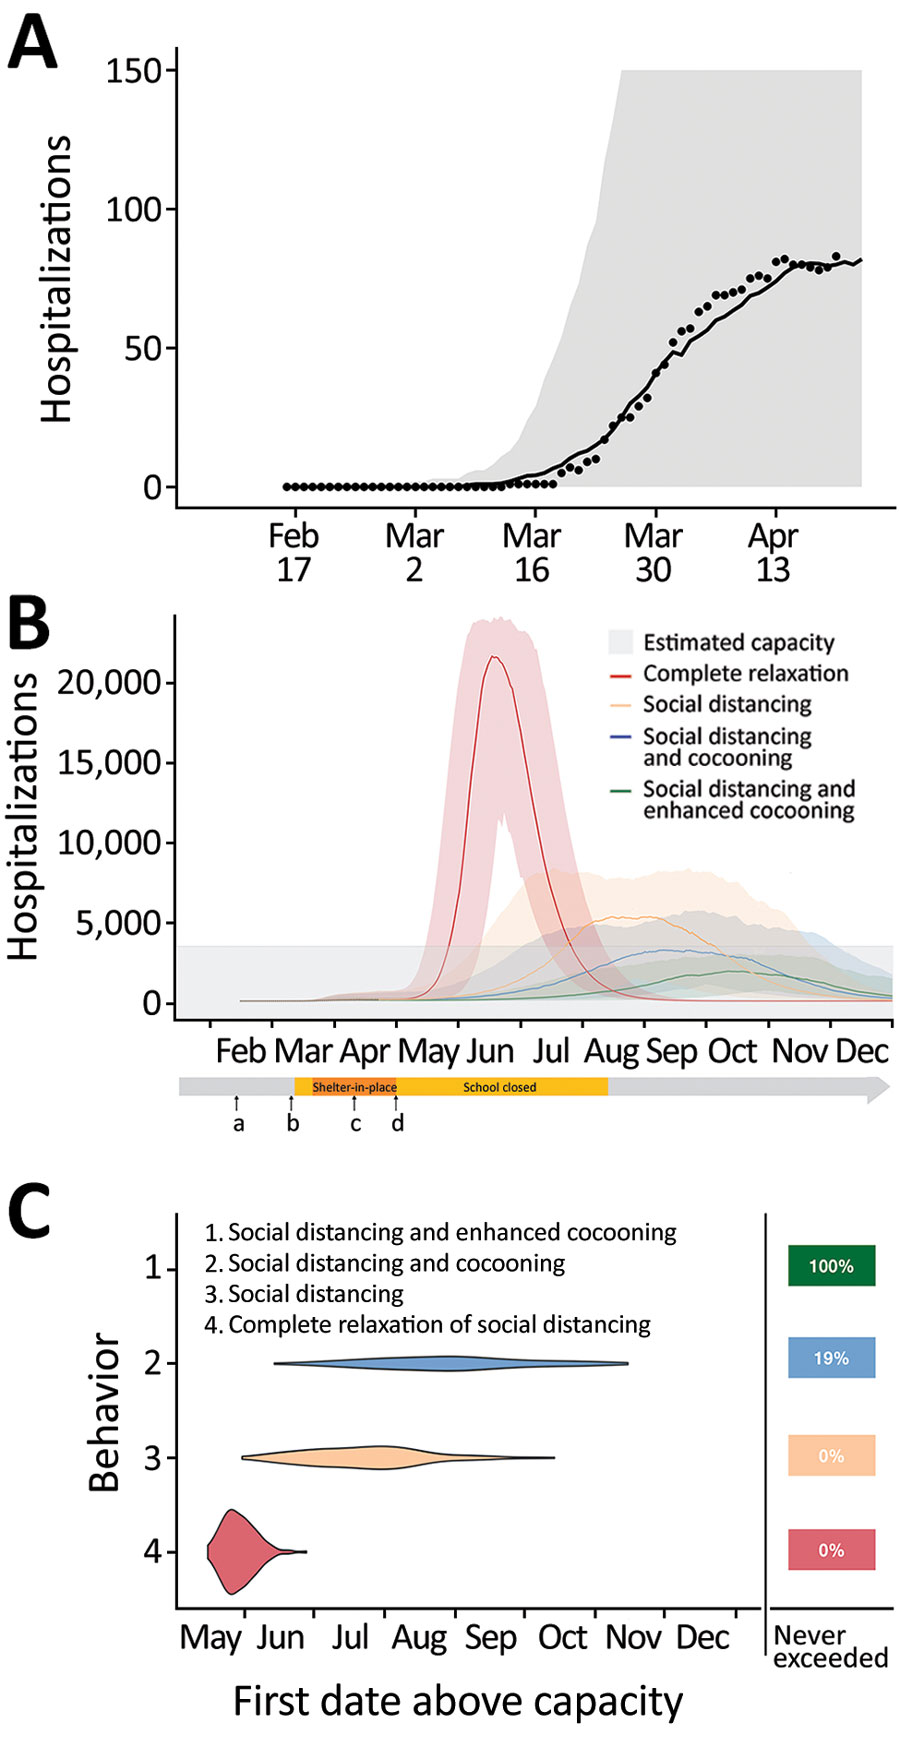
Projected coronavirus disease (COVID-19) hospitalizations during February 16–December 31, 2020, in the Austin-Round Rock Metropolitan Statistical Area, Texas, USA, assuming strict social distancing measures are relaxed on May 1, 2020. A) To calibrate transmission rates before and after Austin’s March 24 Stay Home–Work Safe Order (order 20200324-007; https://www.austintexas.gov), we used least squares to fit our age- and risk-structured susceptible-exposed-infection-recover (SEIR) compartmental model of COVID-19 transmission. Black dots represent daily hospitalization data for the metropolitan area from February 16–April 20, 2020. The curve is the median projection across 200 simulations. Shading represents 95% prediction interval, based on the estimated transmission reduction of 70% beginning March 24. B) Model fitting indicating the ongoing COVID-19 epidemic in Austin. Schools were closed on March 15 and the shelter-in-place order was issued on March 24. a) Date of possible local COVID-19 introduction, February 16; b) date of the first detected case reported, March 13; c) date shelter-in-place order was amended to include cloth face coverings in public, April 13; d) date Texas governor mandated for statewide reopening, May 1. After May 1, we project 4 scenarios in which transmission in low-risk and high-risk groups change relative the reductions achieved during the March 24–May 1 stay-home period: 1) a complete relaxation of measures with transmission rates rebounding to baseline (red); partially relaxed social distancing measures that are 75% as effective as the stay-home order in low-risk groups, with either 2) identical relaxation in high-risk populations (yellow), 3) cocooning that continues to reduce transmission in high-risk groups at the level achieved during the stay-home order (blue), or 4) enhanced cocooning that reduces transmission in high-risk groups further, by 125% relative to the stay home order (green). Lines indicate the median and shading indicates 95% CI across 200 stochastic simulations. Gray shading at bottom indicates 80% of the estimated total daily hospital capacity in the Austin–Round Rock MSA for COVID-19 patients of the 4,299 total beds (3,440). The projections assume that schools open on August 18th. C) The projected first date in 2020 that COVID-19 hospital bed requirements will exceed local capacity for each scenario, as indicated by corresponding colors. The right column indicates the chance that hospitalizations will not exceed capacity in 2020. For example, under enhanced cocooning, we would not expect hospitalizations to exceed capacity.

Figure. Projected coronavirus disease (COVID-19) hospitalizations during February 16–December 31, 2020, in the Austin-Round Rock Metropolitan Statistical Area, Texas, USA, assuming strict social distancing measures are relaxed on May 1, 2020. A) To calibrate transmission rates before and after Austin’s March 24 Stay Home–Work Safe Order (order 20200324-007; https://www.austintexas.gov), we used least squares to fit our age- and risk-structured susceptible-exposed-infection-recover (SEIR) compartmental model of COVID-19 transmission. Black dots represent daily hospitalization data for the metropolitan area from February 16–April 20, 2020. The curve is the median projection across 200 simulations. Shading represents 95% prediction interval, based on the estimated transmission reduction of 70% beginning March 24. B) Model fitting indicating the ongoing COVID-19 epidemic in Austin. Schools were closed on March 15 and the shelter-in-place order was issued on March 24. a) Date of possible local COVID-19 introduction, February 16; b) date of the first detected case reported, March 13; c) date shelter-in-place order was amended to include cloth face coverings in public, April 13; d) date Texas governor mandated for statewide reopening, May 1. After May 1, we project 4 scenarios in which transmission in low-risk and high-risk groups change relative the reductions achieved during the March 24–May 1 stay-home period: 1) a complete relaxation of measures with transmission rates rebounding to baseline (red); partially relaxed social distancing measures that are 75% as effective as the stay-home order in low-risk groups, with either 2) identical relaxation in high-risk populations (yellow), 3) cocooning that continues to reduce transmission in high-risk groups at the level achieved during the stay-home order (blue), or 4) enhanced cocooning that reduces transmission in high-risk groups further, by 125% relative to the stay home order (green). Lines indicate the median and shading indicates 95% CI across 200 stochastic simulations. Gray shading at bottom indicates 80% of the estimated total daily hospital capacity in the Austin–Round Rock MSA for COVID-19 patients of the 4,299 total beds (3,440). The projections assume that schools open on August 18th. C) The projected first date in 2020 that COVID-19 hospital bed requirements will exceed local capacity for each scenario, as indicated by corresponding colors. The right column indicates the chance that hospitalizations will not exceed capacity in 2020. For example, under enhanced cocooning, we would not expect hospitalizations to exceed capacity.

Main Article

Page created: September 08, 2020
Page updated: November 19, 2020
Page reviewed: November 19, 2020
The conclusions, findings, and opinions expressed by authors contributing to this journal do not necessarily reflect the official position of the U.S. Department of Health and Human Services, the Public Health Service, the Centers for Disease Control and Prevention, or the authors' affiliated institutions. Use of trade names is for identification only and does not imply endorsement by any of the groups named above.
file_external