Skip directly to site content Skip directly to page options Skip directly to A-Z link Skip directly to A-Z link Skip directly to A-Z link
Volume 26, Number 12—December 2020
Dispatch

Antibody Profiles According to Mild or Severe SARS-CoV-2 Infection, Atlanta, Georgia, USA, 2020

William T. HuComments to Author , J. Christina Howell, Tugba Ozturk, Karima Benameur, Leda C. Bassit, Richard Ramonell, Kevin S. Cashman, Shama Pirmohammed, John D. Roback, Vincent C. Marconi, Irene Yang, Valerie V. Mac, Daniel Smith, Ignacio Sanz, Whitney Wharton, F. Eun-Hyung Lee, and Raymond F. Schinazi
Author affiliation: Emory University, Atlanta, Georgia, USA

Main Article

Figure 1

Serologic assay results for study participants with coronavirus disease (COVID-19), Atlanta, Georgia, USA, 2020. Levels of IgG against the receptor-binding domain (RBD) of the spike protein subunit S1 (A), IgM against S1 (B), and IgM against envelope protein (C) were analyzed for hospitalized patients with severe COVID-19 (black circles) and patients who had recovered from mild COVID-19 (blue circles) according to time from symptom onset. Levels in pre-2020 HC participants (gray circles) are shown for comparison; dotted lines represent optimal threshold levels for receiver operating characteristic curve analysis. Best fit lines for relationships between time since symptom onset and antibody levels were calculated separately for hospitalized participants and participants with mild COVID-19. OD, optical density.

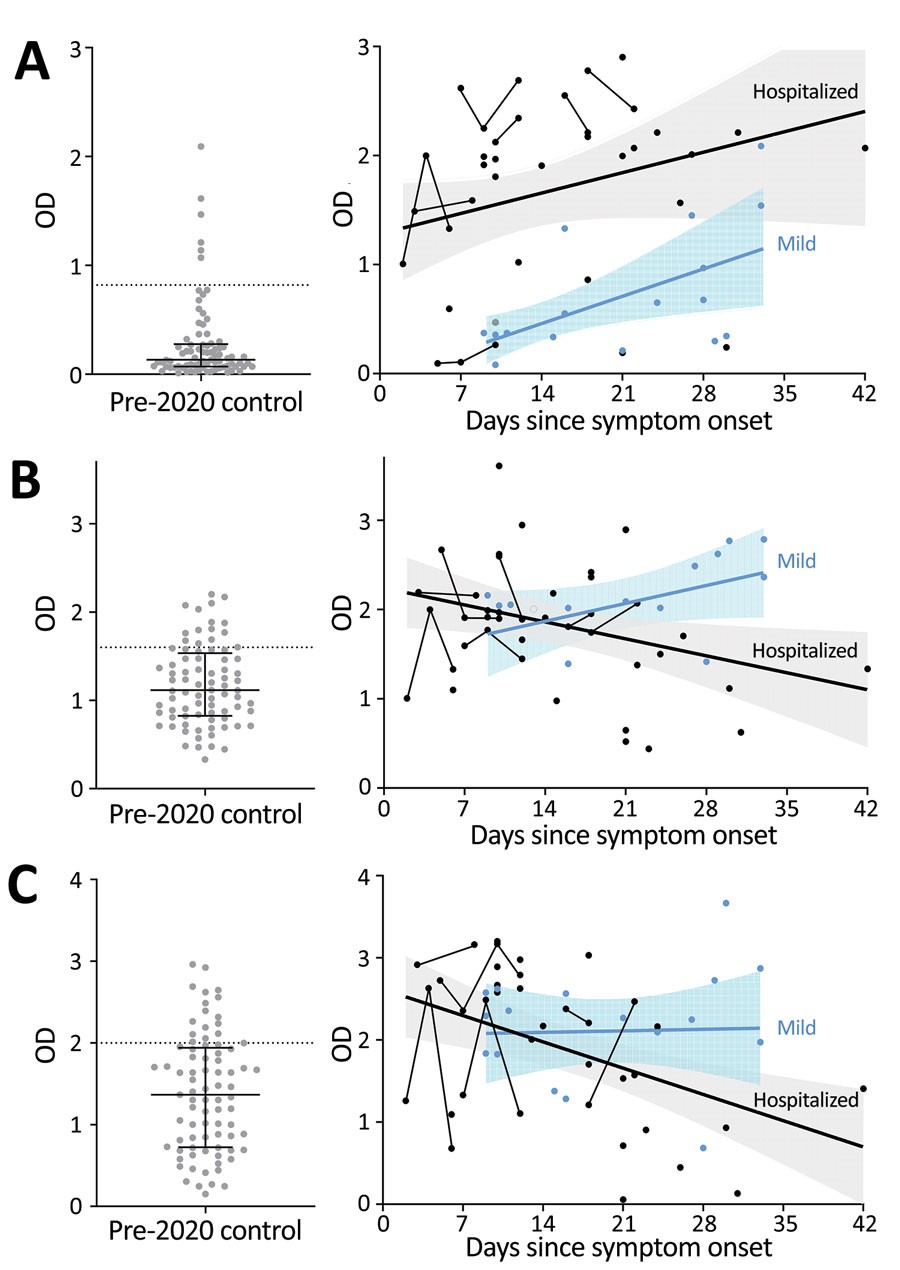
Figure 1. Serologic assay results for study participants with coronavirus disease (COVID-19), Atlanta, Georgia, USA, 2020. Levels of IgG against the receptor-binding domain (RBD) of the spike protein subunit S1 (A), IgM against S1 (B), and IgM against envelope protein (C) were analyzed for hospitalized patients with severe COVID-19 (black circles) and patients who had recovered from mild COVID-19 (blue circles) according to time from symptom onset. Levels in pre-2020 HC participants (gray circles) are shown for comparison; dotted lines represent optimal threshold levels for receiver operating characteristic curve analysis. Best fit lines for relationships between time since symptom onset and antibody levels were calculated separately for hospitalized participants and participants with mild COVID-19. OD, optical density.

Main Article

Page created: August 28, 2020
Page updated: November 19, 2020
Page reviewed: November 19, 2020
The conclusions, findings, and opinions expressed by authors contributing to this journal do not necessarily reflect the official position of the U.S. Department of Health and Human Services, the Public Health Service, the Centers for Disease Control and Prevention, or the authors' affiliated institutions. Use of trade names is for identification only and does not imply endorsement by any of the groups named above.
file_external