Volume 26, Number 4—April 2020
Research
Comprehensive Profiling of Zika Virus Risk with Natural and Artificial Mitigating Strategies, United States
Figure 1
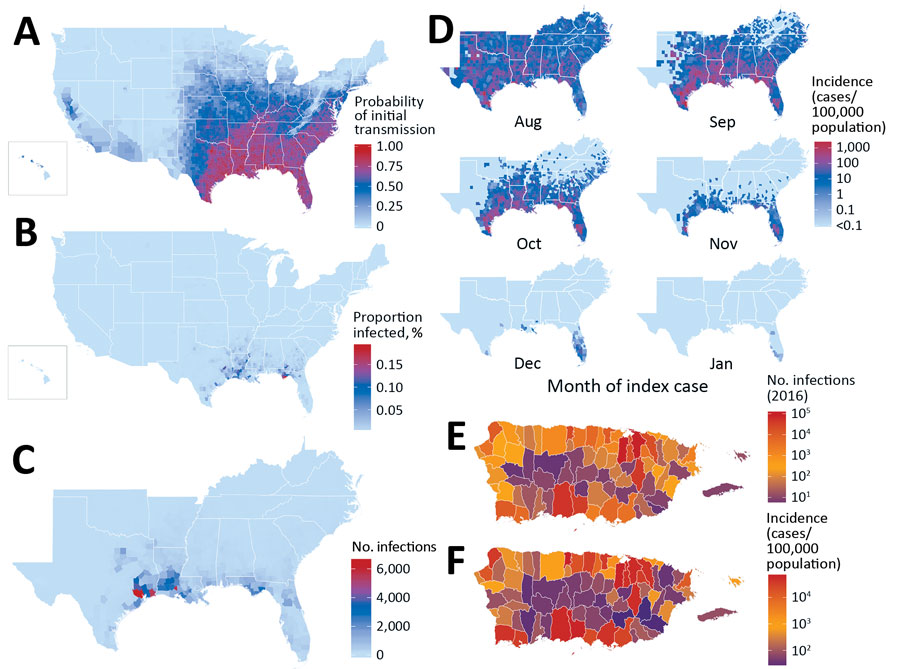
Figure 1. County-level Zika virus risk profiling, United States including Puerto Rico. A) Probability of initial transmission from an index case introduced during peak vector abundance, calculated as the proportion of simulations with >1 transmission event, for every county. B) Proportion of population infected. C) Total case counts for the southeastern United States (nationwide data depicted in Appendix Figure 6) when transmission does occur after index cases during peak abundance (median calculated among simulation with >1 transmission event). D) Monthly incidence and duration of outbreaks. Shown is the median monthly incidence of Zika virus infections from August index cases. E) Total number of simulated exposures in Puerto Rico ending December 31, 2016. F) Final epidemic size (incidence) at the end of simulations. For panels E and F, imports into each municipality corresponded temporally with initial cases reported in 2015 and 2016. All simulations assess counties and municipalities independently.
1These authors contributed equally to this article.