Volume 26, Number 4—April 2020
Research
Comprehensive Profiling of Zika Virus Risk with Natural and Artificial Mitigating Strategies, United States
Figure 4

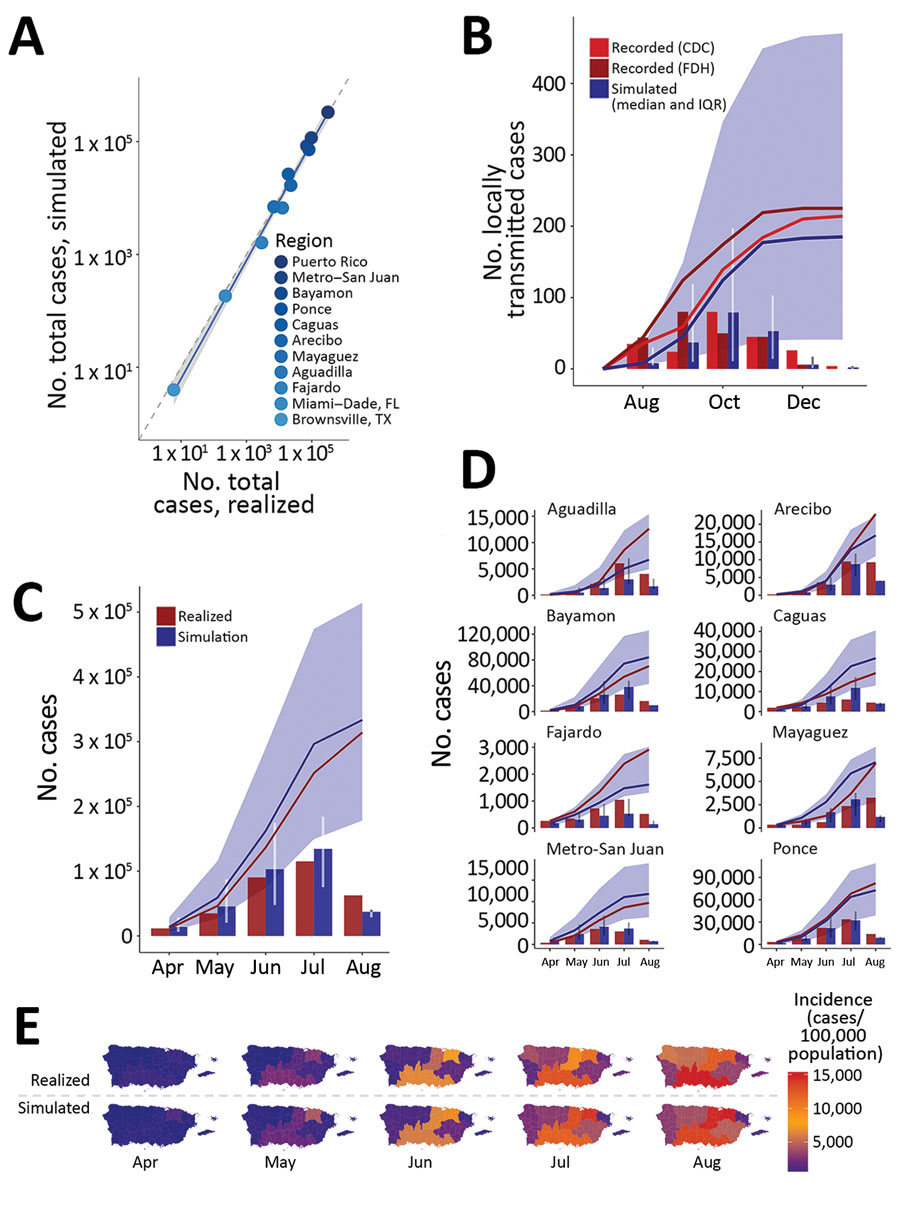
Figure 4. Model validation for Zika virus infection cases reported or estimated and simulated for outbreaks, United States including Puerto Rico, 2016. A) Total cases (median simulated) versus total cases reported or estimated (realized) for each of the regions are plotted as a scatter plot. Dotted line indicates 1:1 relationship. B–D) Monthly and cumulative simulated cases are plotted against reported or estimated cases for (B) Miami–Dade County, Florida, (C) Puerto Rico, and (D) each of the 8 health regions of Puerto Rico. Dark blue columns and line in panel B show monthly and cumulative case counts for the median simulated outbreak (among simulations with >1 transmission event) and shaded region shows the interquartile range. Red columns and red solid lines indicate the respective monthly and cumulative cases recorded or estimated, as noted. Data in panels C and D are as in B, but summed over the constituent municipalities (i.e., the dark blue line in panel C shows the sum of the cumulative case counts for each municipality in Puerto Rico). For panels C and D, validation data were available only for April 3–August 12, and thus realized and simulated case counts represent only cases measured or predicted within this period. E) Cumulative cases realized (upper panel) and simulated (lower panel) for each health region of Puerto Rico during April–August 2016. Validation data were available only for April 3–August 12, and thus realized and simulated case counts represent only cases measured or predicted within this period. CDC, Centers for Disease Control and Prevention; FDH, Florida Department of Health; IQR, interquartile range.
1These authors contributed equally to this article.