Skip directly to site content Skip directly to page options Skip directly to A-Z link Skip directly to A-Z link Skip directly to A-Z link
Volume 26, Number 4—April 2020
Research

Comprehensive Profiling of Zika Virus Risk with Natural and Artificial Mitigating Strategies, United States

Michael J. Mina1, L. Beryl Guterman1Comments to Author , Kristen E. Allen, and Saad B. Omer
Author affiliations: Harvard T.H. Chan School of Public Health, Boston, Massachusetts, USA (M.J. Mina); Harvard Medical School, Boston (M.J. Mina); Jacobs School of Medicine and Biomedical Sciences, University at Buffalo, Buffalo, New York, USA (L.B. Guterman); Emory University, Atlanta, Georgia, USA (L.B. Guterman, K.E. Allen); Yale Institute for Global Health, New Haven, Connecticut, USA (S.B. Omer); Yale School of Medicine, New Haven (S.B. Omer); Yale School of Public Health, New Haven (S.B. Omer)

Main Article

Figure 2

Zika virus infections during pregnancy and effects of natural birth dynamics, United States including Puerto Rico. A) Standardized prevalence of first-, second-, and third-trimester pregnancies throughout a year in the southeast United States and Texas are plotted against the simulated and standardized Zika epidemic curves for each county and for every month of import. Thin purple lines indicate county-specific prevalence of pregnancy in each respective trimester, and thick purple lines show a g

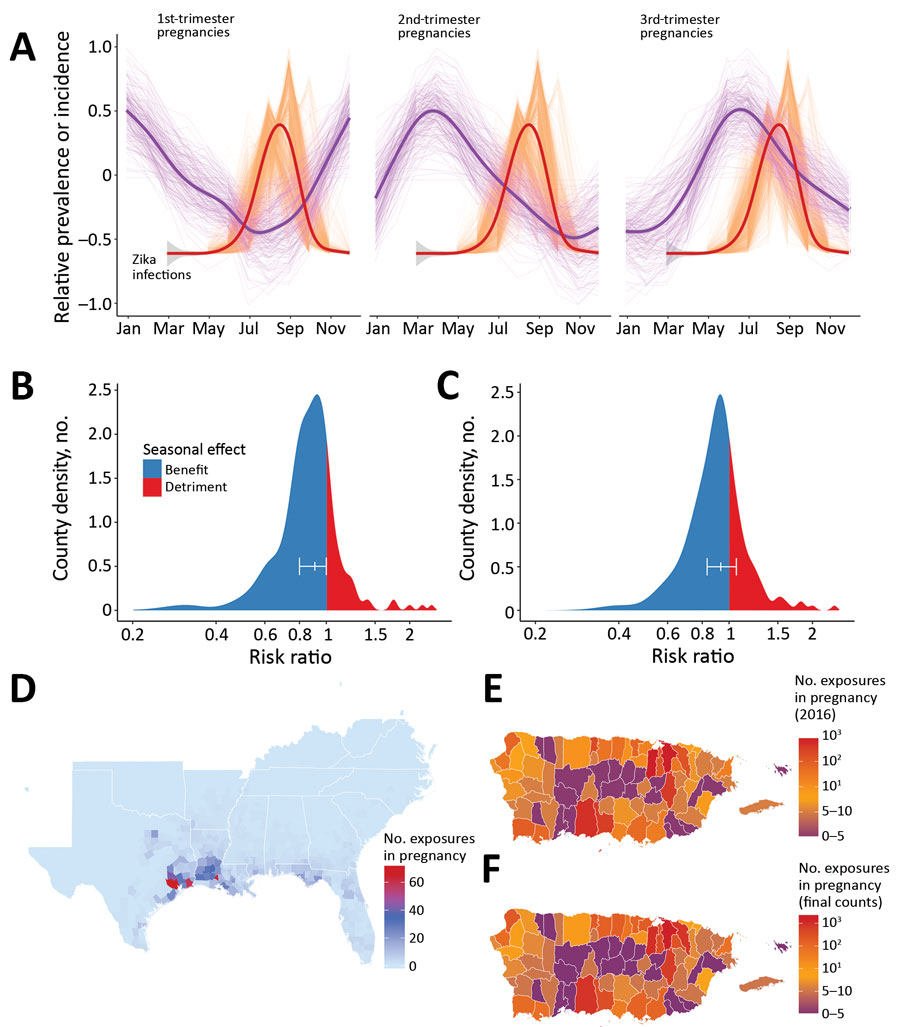
Figure 2. Zika virus infections during pregnancy and effects of natural birth dynamics, United States including Puerto Rico. A) Standardized prevalence of first-, second-, and third-trimester pregnancies throughout a year in the southeastern United States and Texas are plotted against the simulated and standardized Zika epidemic curves for each county and for every month of import. Thin purple lines indicate county-specific prevalence of pregnancy in each respective trimester, and thick purple lines show a generalized additive model fit. Thin orange lines indicate median outbreak per county, including distinct lines for each month of import during March–November. Thick orange line is a generalized additive model fit to the county-level data. B, C) Zika virus exposure risk ratio and 95% CI during (B) first (versus third) and (C) second (versus third) trimester of pregnancy, driven by the dynamics depicted in panel A (Appendix Table 2). D) Median number of infections (simulated) during pregnancy when index cases are imported during peak vector abundance. E, F) Median number of infections (simulated) during pregnancy for each municipality (E) in Puerto Rico in 2016 and (F) over the entire epidemic. Data in panels E and F include index cases that were introduced into each municipality to correspond with initial introductions reported in the current epidemic

Main Article

1These authors contributed equally to this article.

Page created: March 17, 2020
Page updated: March 17, 2020
Page reviewed: March 17, 2020
The conclusions, findings, and opinions expressed by authors contributing to this journal do not necessarily reflect the official position of the U.S. Department of Health and Human Services, the Public Health Service, the Centers for Disease Control and Prevention, or the authors' affiliated institutions. Use of trade names is for identification only and does not imply endorsement by any of the groups named above.
file_external