Effectiveness of Live Poultry Market Interventions on Human Infection with Avian Influenza A(H7N9) Virus, China
Wei Wang
1, Jean Artois
1, Xiling Wang, Adam J. Kucharski, Yao Pei, Xin Tong, Victor Virlogeux, Peng Wu, Benjamin J. Cowling, Marius Gilbert
2, and Hongjie Yu
2
Author affiliations: Fudan University School of Public Health, Shanghai, China (W. Wang, X. Wang, Y. Pei, X. Tong, H. Yu); Université Libre de Bruxelles, Brussels, Belgium (J. Artois, M. Gilbert); London School of Hygiene and Tropical Medicine, London, UK (A.J. Kucharski); École Normale Supérieure de Lyon, Lyon, France (V. Virlogeux); Cancer Research Center of Lyon, Lyon (V. Virlogeux); School of Public Health, University of Hong Kong, Hong Kong, China (V. Virlogeux, P. Wu, B.J. Cowling); Fonds National de la Recherche Scientifique, Brussels (M. Gilbert)
Main Article
Figure 3
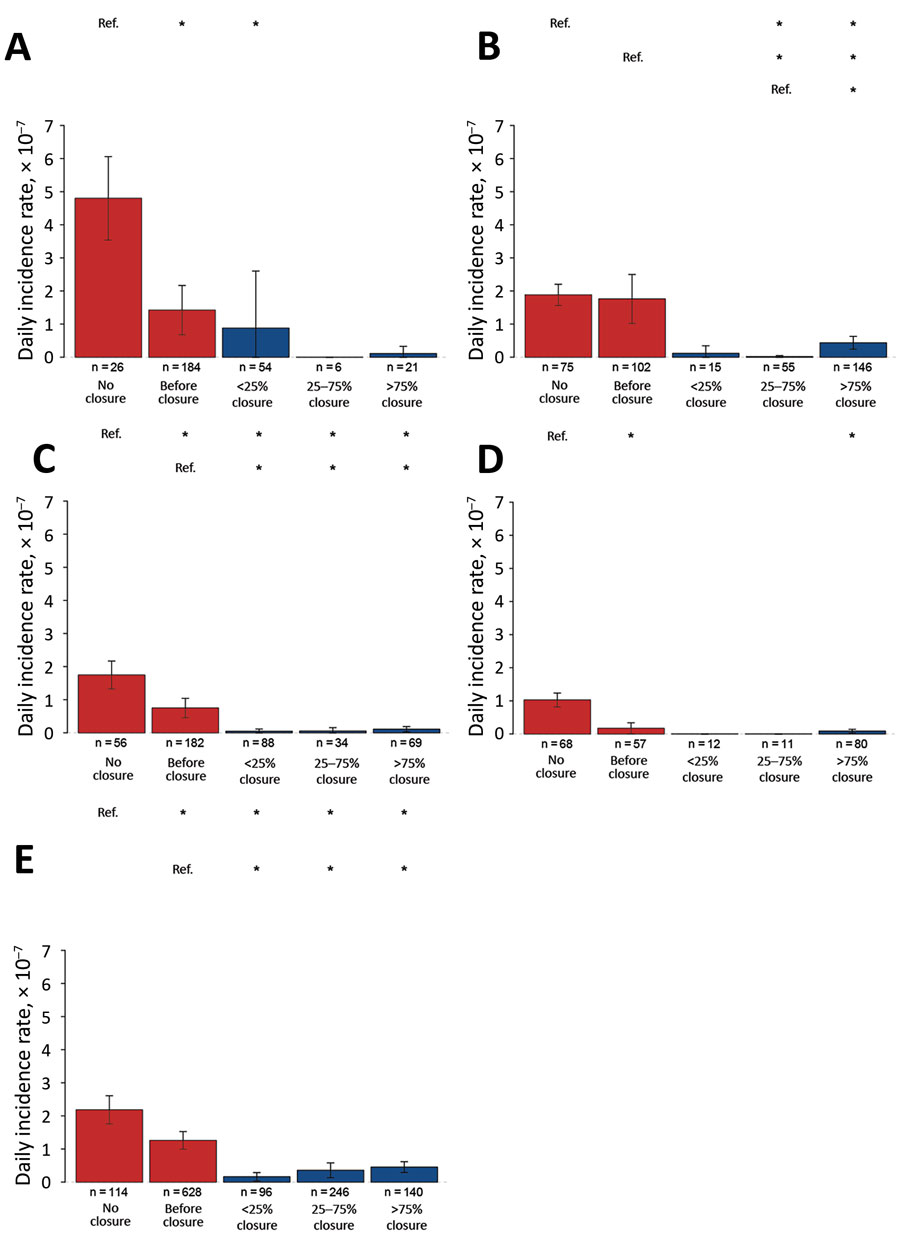
Figure 3. Estimated daily incidence rates in counties with various levels of live poultry market (LPM) closures across waves of influenza A(H7N9) infections, by proportion of closure days during epidemic wave, China, 2013–2017. A) Wave 1; B) wave 2; C) wave 3; D) wave 4; E) wave 5. Error bars indicate 95% CIs. Asterisks (*) above bars indicate statistically significant (p<0.05) differences between daily incidence rates and reference category (Ref.) rates. Proportion categories: no closure; before closure, incidence rate before market was closed; <25%, closed <25% of the days of the wave duration; 25%–75%, closed 25%–75% of the days of the wave duration; >75%, closed >75% of the days of the wave duration.
Main Article
Page created: April 16, 2020
Page updated: April 16, 2020
Page reviewed: April 16, 2020
The conclusions, findings, and opinions expressed by authors contributing to this journal do not necessarily reflect the official position of the U.S. Department of Health and Human Services, the Public Health Service, the Centers for Disease Control and Prevention, or the authors' affiliated institutions. Use of trade names is for identification only and does not imply endorsement by any of the groups named above.