Volume 26, Number 6—June 2020
Research Letter
Serial Interval of COVID-19 among Publicly Reported Confirmed Cases
Cite This Article
Citation for Media
Abstract
We estimate the distribution of serial intervals for 468 confirmed cases of coronavirus disease reported in China as of February 8, 2020. The mean interval was 3.96 days (95% CI 3.53–4.39 days), SD 4.75 days (95% CI 4.46–5.07 days); 12.6% of case reports indicated presymptomatic transmission.
Key aspects of the transmission dynamics of coronavirus disease (COVID-19) remain unclear (1). The serial interval of COVID-19 is defined as the time duration between a primary case-patient (infector) having symptom onset and a secondary case-patient (infectee) having symptom onset (2). The distribution of COVID-19 serial intervals is a critical input for determining the basic reproduction number (R0) and the extent of interventions required to control an epidemic (3).
To obtain reliable estimates of the serial interval, we obtained data on 468 COVID-19 transmission events reported in mainland China outside of Hubei Province during January 21–February 8, 2020. Each report consists of a probable date of symptom onset for both the infector and infectee, as well as the probable locations of infection for both case-patients. The data include only confirmed cases compiled from online reports from 18 provincial centers for disease control and prevention (https://github.com/MeyersLabUTexas/COVID-19).
Figure
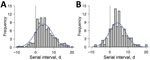
Figure. Estimated serial interval distribution for coronavirus disease (COVID-19) based on 468 reported transmission events, China, January 21–February 8, 2020. A) All infection events (N = 468) reported across 93 cities of...
Fifty-nine of the 468 reports indicate that the infectee had symptoms earlier than the infector. Thus, presymptomatic transmission might be occurring. Given these negative-valued serial intervals, COVID-19 serial intervals seem to resemble a normal distribution more than the commonly assumed gamma or Weibull distributions (4,5), which are limited to positive values (Appendix). We estimate a mean serial interval for COVID-19 of 3.96 (95% CI 3.53–4.39) days, with an SD of 4.75 (95% CI 4.46–5.07) days, which is considerably lower than reported mean serial intervals of 8.4 days for severe acute respiratory syndrome (5) to 14.6 days (6) for Middle East respiratory syndrome. The mean serial interval is slightly but not significantly longer when the index case is imported (4.06 [95% CI 3.55–4.57] days) versus locally infected (3.66 [95% CI 2.84–4.47] days), but slightly shorter when the secondary transmission occurs within the household (4.03 [95% CI 3.12–4.94] days) versus outside the household (4.56 [95% CI 3.85–5.27] days) (Figure). Combining these findings with published estimates for the early exponential growth rate COVID-19 in Wuhan (7), we estimate an R0 of 1.32 (95% CI 1.16–1.48) (5), which is lower than published estimates that assume a mean serial interval exceeding 7 days (7,8).
These estimates reflect reported symptom onset dates for 752 case-patients from 93 cities in China, who range in age from 1 to 90 years (mean 45.2 years, SD 17.21 years). Recent analyses of putative COVID-19 infector–infectee pairs from several countries have indicated average serial intervals of 4.0 days (95% CI 3.1–4.9 days; n = 28; unpub. data, H. Nishiura et al., unpub. data, https://doi.org/10.1101/2020.02.03.20019497), 4.4 days (95% CI 2.9–6.7 days, n = 21; S. Zhao et al., unpub. data, https://doi.org/10.1101/2020.02.21.20026559], and 7.5 days (95% CI 5.3–19, n = 6; 8). Whereas none of these studies report negative serial intervals in which the infectee had symptoms before the infector, 12.6% of the serial intervals in our sample were negative.
We note 4 potential sources of bias. First, the data are restricted to online reports of confirmed cases and therefore might be biased toward more severe cases in areas with a high-functioning healthcare and public health infrastructure. The rapid isolation of such case-patients might have prevented longer serial intervals, potentially shifting our estimate downward compared with serial intervals that might be observed in an uncontrolled epidemic. Second, the distribution of serial intervals varies throughout an epidemic; the time between successive cases contracts around the epidemic peak (9). A susceptible person is likely to become infected more quickly if they are surrounded by 2 infected persons instead of 1. Because our estimates are based primarily on transmission events reported during the early stages of outbreaks, we do not explicitly account for such compression and interpret the estimates as basic serial intervals at the outset of an epidemic. However, if some of the reported infections occurred amid growing clusters of cases, then our estimates might reflect effective (compressed) serial intervals that would be expected during a period of epidemic growth. Third, the identity of each infector and the timing of symptom onset were presumably based on individual recollection of past events. If recall accuracy is impeded by time or trauma, case-patients might be more likely to attribute infection to recent encounters (short serial intervals) over past encounters (longer serial intervals). In contrast, the reported serial intervals might be biased upward by travel-related delays in transmission from primary case-patients that were infected in Wuhan or another city before returning home. If their infectious period started during travel, then we might be unlikely to observe early transmission events with shorter serial intervals. The mean serial interval is slightly higher for the 218 of 301 unique infectors reported to have imported cases.
Given the heterogeneity in type and reliability of these sources, we caution that our findings should be interpreted as working hypotheses regarding the infectiousness of COVID-19, requiring further validation. The potential implications for COVID-19 control are mixed. Although our lower estimates for R0 suggest easier containment, the large number of reported asymptomatic transmission events is concerning.
Dr. Du is a postdoctoral researcher in the Department of Integrative Biology at the University of Texas at Austin. He develops mathematical models to elucidate the transmission dynamics, surveillance, and control of infectious diseases.
Acknowledgment
We acknowledge the financial support from the US National Institutes of Health (grant no. U01 GM087719) and the National Natural Science Foundation of China (grant no. 61773091).
References
- Cowling BJ, Leung GM. Epidemiological research priorities for public health control of the ongoing global novel coronavirus (2019-nCoV) outbreak. Euro Surveill. 2020;25.
- Svensson A. A note on generation times in epidemic models. Math Biosci. 2007;208:300–11. DOIPubMedGoogle Scholar
- Wallinga J, Lipsitch M. How generation intervals shape the relationship between growth rates and reproductive numbers. Proc Biol Sci. 2007;274:599–604. DOIPubMedGoogle Scholar
- Kuk AYC, Ma S. The estimation of SARS incubation distribution from serial interval data using a convolution likelihood. Stat Med. 2005;24:2525–37. DOIPubMedGoogle Scholar
- Lipsitch M, Cohen T, Cooper B, Robins JM, Ma S, James L, et al. Transmission dynamics and control of severe acute respiratory syndrome. Science. 2003;300:1966–70. DOIPubMedGoogle Scholar
- Park SH, Kim Y-S, Jung Y, Choi SY, Cho N-H, Jeong HW, et al. Outbreaks of Middle East respiratory syndrome in two hospitals initiated by a single patient in Daejeon, South Korea. Infect Chemother. 2016;48:99–107. DOIPubMedGoogle Scholar
- Li Q, Guan X, Wu P, Wang X, Zhou L, Tong Y, et al. Early transmission dynamics in Wuhan, China, of novel coronavirus-infected pneumonia. N Engl J Med. 2020 Jan 29 [Epub ahead of print].
- Wu JT, Leung K, Leung GM. Nowcasting and forecasting the potential domestic and international spread of the 2019-nCoV outbreak originating in Wuhan, China: a modelling study. Lancet. 2020;395:689–97. DOIPubMedGoogle Scholar
- Kenah E, Lipsitch M, Robins JM. Generation interval contraction and epidemic data analysis. Math Biosci. 2008;213:71–9. DOIPubMedGoogle Scholar
Figure
Cite This ArticleOriginal Publication Date: March 19, 2020
1These first authors contributed equally to this article.
Table of Contents – Volume 26, Number 6—June 2020
| EID Search Options |
|---|
|
|
|
|
|
|
Please use the form below to submit correspondence to the authors or contact them at the following address:
Lauren Ancel Meyers, J.T. Patterson Labs Bldg, University of Texas at Austin, 2415 Speedway, Austin, TX 78712, USA
Top