Volume 26, Number 7—July 2020
Research
High Contagiousness and Rapid Spread of Severe Acute Respiratory Syndrome Coronavirus 2
Figure 3
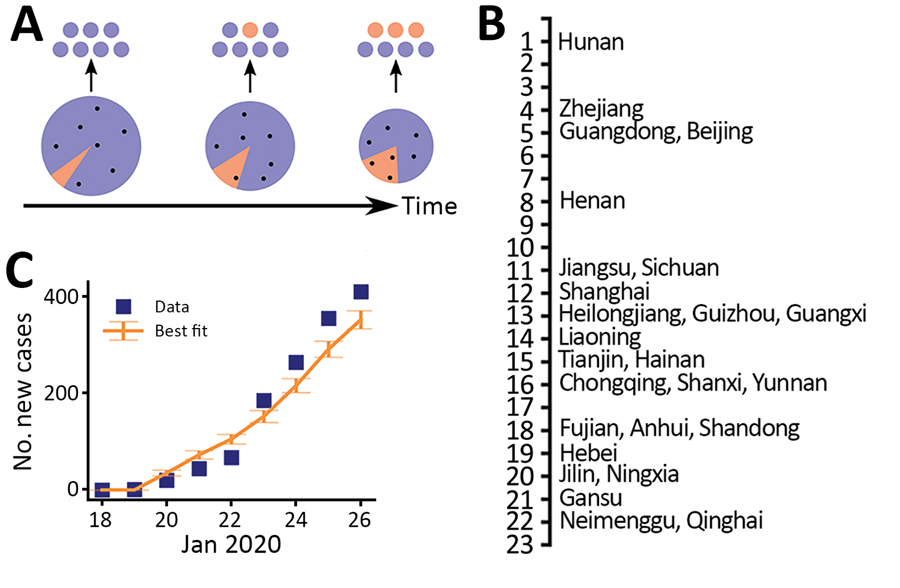
Figure 3. Estimates of the exponential growth rate and the date of exponential growth initiation of the 2019 novel coronavirus disease outbreak in China based on 2 different approaches. A) Schematic illustrating the export of infected persons from Wuhan. Travelers (dots) are assumed to be random samples from the total population (whole pie). Because of the growth of the infected population (orange pie) and the shrinking size of the total population in Wuhan over time, probability of infected persons traveling to other provinces increases (orange dots). B) The dates of documented first arrivals of infected persons in 26 provinces. C) Best fit of the case count model to daily counts of new cases (including only imported cases) in provinces other than Hubei. Error bars indicate SDs.
1These first authors contributed equally to this article.