Volume 26, Number 8—August 2020
Dispatch
SARS-CoV-2 Phylogenetic Analysis, Lazio Region, Italy, February–March 2020
Figure

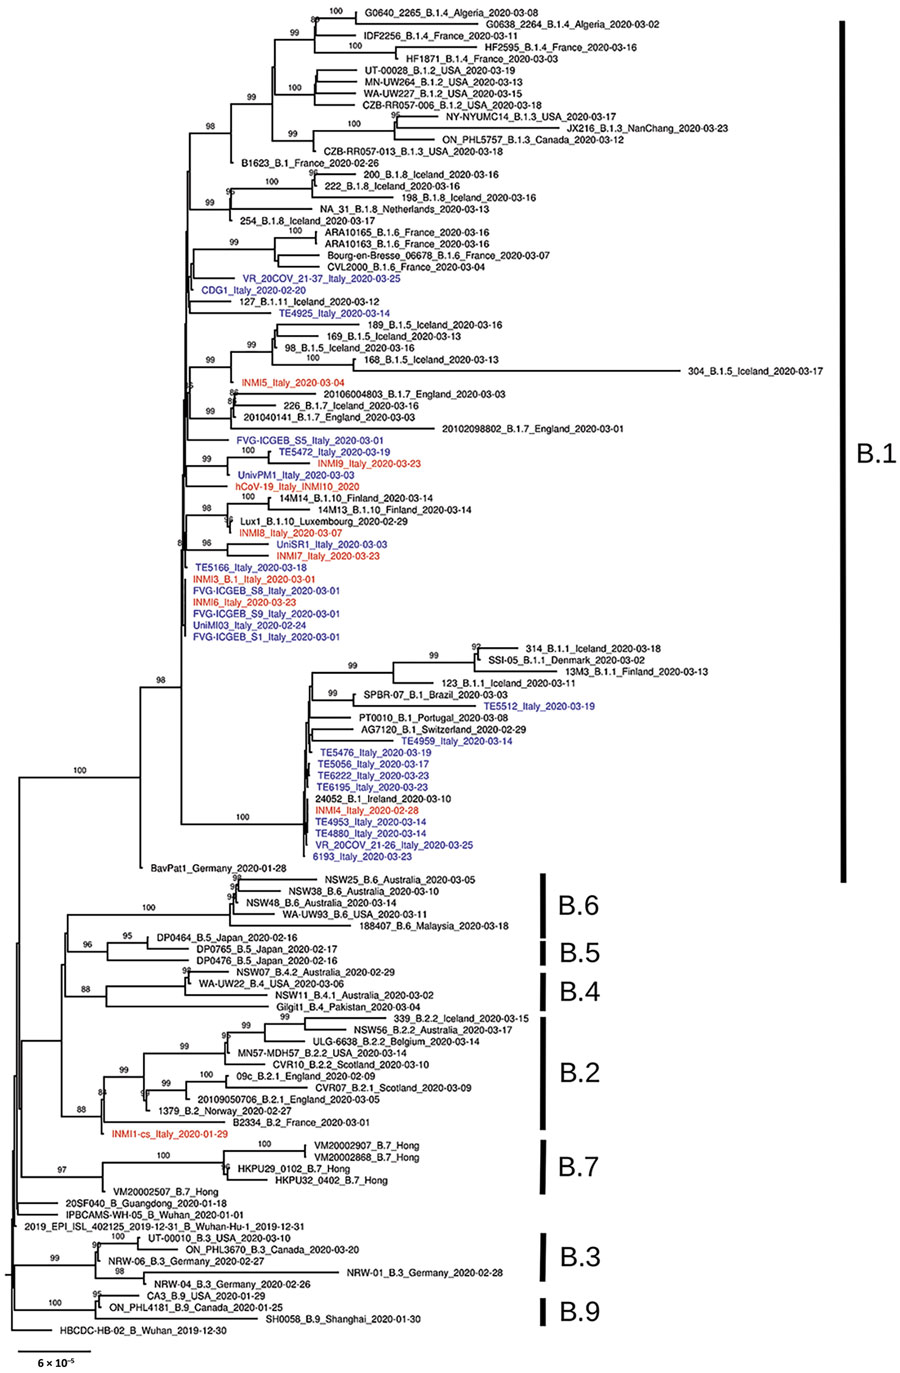
Figure. Phylogenetic analysis of 150 severe acute respiratory syndrome coronavirus 2 representative genome sequences, including genomes collected in Italy (blue) and sequences identified for this study at the National Institute for Infectious Diseases (red). Available genomes were retrieved from GISAID (https://www.gisaid.org) on April 10, 2020; we discarded sequences with low coverage depth (low amount of read sequenced) or low coverage length (not complete genome sequences). Representative sequences from every B lineage (A. Rambaut et al., unpub. data, https://doi.org/10.1101/2020.04.17.046086v1), together with all genome sequences collected in Italy so far, were selected for further analysis. Multiple sequence alignment was obtained with MAFFT version 7.271 (https://mafft.cbrc.jp/alignment/software). Phylogenetic analysis was performed with IQ-TREE (http://www.iqtree.org): transition model with empirical base frequencies and invariable sites was selected with ModelFinder, and the best tree was found performing 1,000 bootstrap ultrafast replicates. Bootstrap values of >80% are reported on each branch. Lineages according to the description by Rambaut et al. are marked to the right of the tree. Scale bar represents number of substitutions per site.