Volume 27, Number 11—November 2021
Research
Hepatitis A Virus Incidence Rates and Biomarker Dynamics for Plasma Donors, United States
Stephanie Schoch, Martin Wälti, Mathias Schemmerer, Rick Alexander, Björn Keiner, Carol Kralicek, Keith Bycholski, Kelley Hyatt, Jon Knowles, Denis Klochkov , Toby Simon, Jürgen J. Wenzel, Nathan J. Roth, and Eleonora Widmer
Figure 2
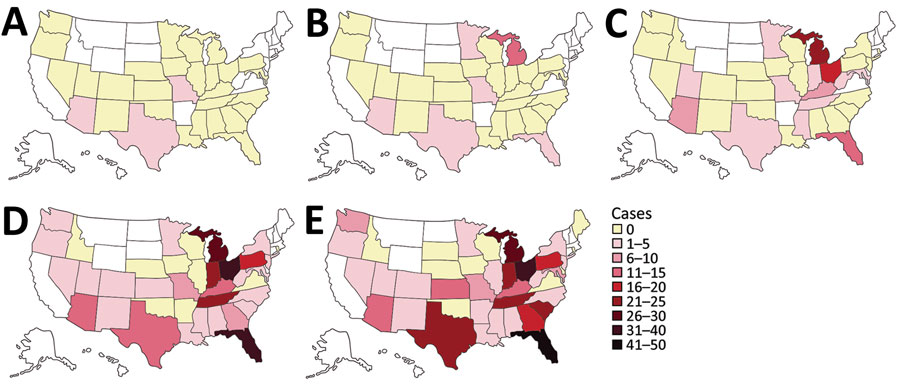
Figure 2. Geographic distribution of hepatitis A virus–positive plasma donors, United States, 2016‒2020. Cumulative case counts are indicated: A) 2016; B) 2016–2017; C) 2016–2018; D) 2016–2019; E) 2016–2020. These counts reflect how hepatitis A outbreaks in the United States have spread and spilled over into the plasma donor population over time. No color indicates states for which no data are available (no plasma collection). Maps were created by using an Adobe Stock template (https://stock.adobe.com).
Page created: August 02, 2021
Page updated: October 19, 2021
Page reviewed: October 19, 2021
The conclusions, findings, and opinions expressed by authors contributing to this journal do not necessarily reflect the official position of the U.S. Department of Health and Human Services, the Public Health Service, the Centers for Disease Control and Prevention, or the authors' affiliated institutions. Use of trade names is for identification only and does not imply endorsement by any of the groups named above.