Volume 27, Number 11—November 2021
Research
Hepatitis A Virus Incidence Rates and Biomarker Dynamics for Plasma Donors, United States
Figure 4
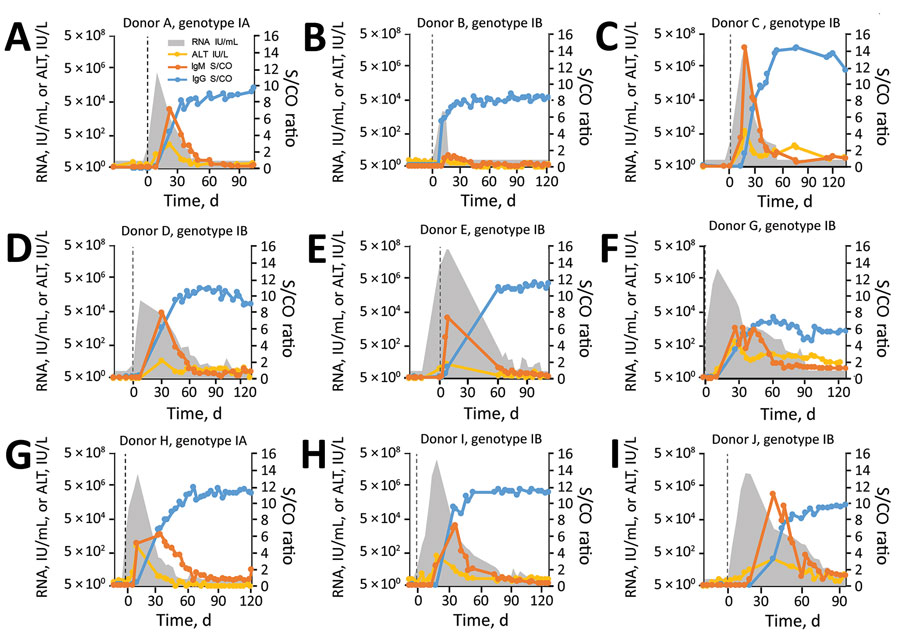
Figure 4. HAV biologic and clinical marker dynamics in plasma donors, United States. Quantitative HAV RNA and ALT results, as well as semiquantitative HAV IgM and IgG results, are shown for all 9 donors who seroconverted. Vertical dashed lines indicate day 0, the earliest collection date with detectable HAV RNA. Reactive nucleic acid testing results below the validated limit of detection of 14 IU/mL are not shown. The IgG result is defined as nonreactive/reactive for S/CO ratios <1 and ≥1, respectively. The IgM assay is defined as nonreactive/reactive for S/CO ratios <0.80 and >1.20, respectively, and as gray zone reactive for S/CO ratios of 0.80‒1.20. The results of a tenth donor (donor F) who had 1 confirmed weak-positive HAV RNA result and all nonreactive IgM/IgG results is not shown but is described in the Results. The figure illustrates the extensive individual variation in viremia curves and timing of biomarker events. ALT, alanine aminotransferase; HAV, hepatitis A virus; S/CO, signal-to-cutoff ratio.