Transmission of Severe Acute Respiratory Syndrome Coronavirus 2 in Households with Children, Southwest Germany, May–August 2020
Maximilian Stich
1, Roland Elling
1, Hanna Renk
1, Aleš Janda
1, Sven F. Garbade, Barbara Müller, Hans-Georg Kräusslich, Dorit Fabricius, Maria Zernickel, Peter Meissner, Daniela Huzly, Jürgen Grulich-Henn, Anneke Haddad, Tessa Görne, Benedikt Spielberger, Linus Fritsch, Alexandra Nieters, Hartmut Hengel, Andrea N. Dietz, Thomas Stamminger, Tina Ganzenmueller, Natalia Ruetalo, Andreas Peter, Jonathan Remppis, Thomas Iftner, Kathrin Jeltsch, Tim Waterboer, Axel R. Franz, Georg Friedrich Hoffmann, Corinna Engel
2, Klaus-Michael Debatin
2, Burkhard Tönshoff
2
, and Philipp Henneke
2
Author affiliations: Heidelberg University Hospital, Heidelberg, Germany (M. Stich, S.F. Garbade, B. Müller, H.-G. Kräusslich, J. Grulich-Henn, K. Jeltsch, G.F. Hoffmann, B. Tönshoff); University Medical Centre and Faculty of Medicine Freiburg, Freiburg, Germany (R. Elling, D. Huzly, A. Haddad, T. Görne, B. Spielberger, L. Fritsch, A. Nieters, H. Hengel, P. Henneke); University Hospital and Faculty of Medicine Tübingen, Tübingen, Germany (H. Renk, T. Ganzenmueller, N. Ruetalo, A. Peter, J. Remppis, T. Iftner, A.R. Franz, C. Engel); Ulm University Medical Center, Ulm, Germany (A. Janda, D. Fabricius, M. Zernickel, P. Meissner, A.N. Dietz, T. Stamminger, K.-M. Debatin); German Cancer Research Center (DKFZ), Heidelberg (T. Waterboer)
Main Article
Figure 2
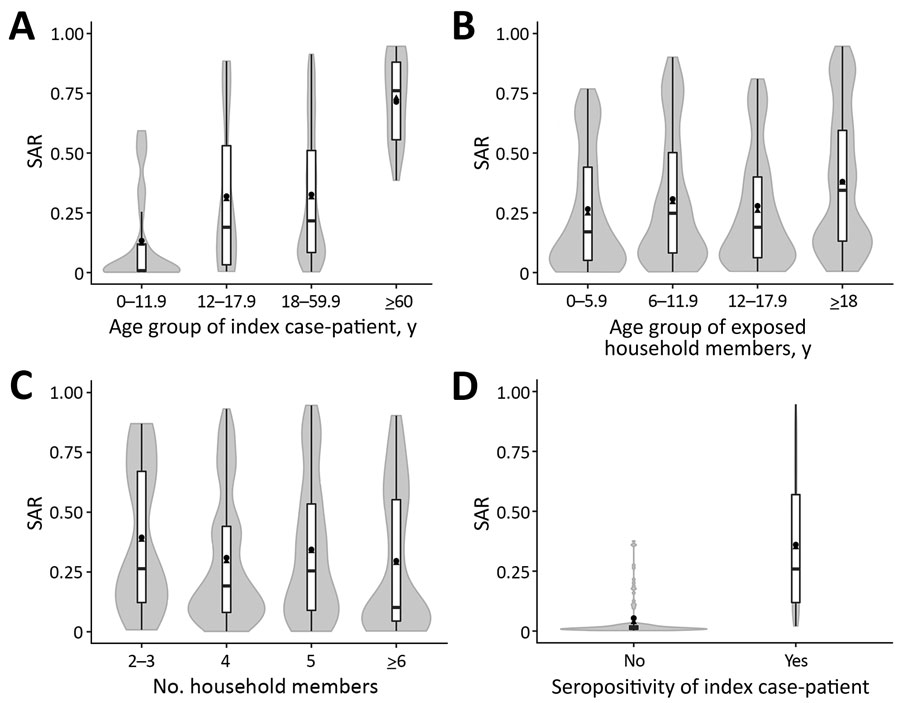
Figure 2. Observed and predicted SARs in household members exposed to severe acute respiratory syndrome coronavirus 2, southwest Germany, May–August 2020. SARs shown are associated with age of index case-patient (A), age of exposed household member (B), household size (C), and SARS-CoV-2 seropositivity of the index case-patient (D). The mean observed SAR is shown as a black dot. The mean (black triangles), interquartile range (white bars), maximum and minimum (ends of vertical black line), and distribution (gray shading) of the predicted SAR are shown in the violin plots. The predicted SARs were calculated from the generalized linear mixed-effects logistic regression model. SAR, secondary attack rate.
Main Article
Page created: September 16, 2021
Page updated: November 19, 2021
Page reviewed: November 19, 2021
The conclusions, findings, and opinions expressed by authors contributing to this journal do not necessarily reflect the official position of the U.S. Department of Health and Human Services, the Public Health Service, the Centers for Disease Control and Prevention, or the authors' affiliated institutions. Use of trade names is for identification only and does not imply endorsement by any of the groups named above.