Volume 27, Number 12—December 2021
Research
SARS-CoV-2 Seroprevalence in a Rural and Urban Household Cohort during First and Second Waves of Infections, South Africa, July 2020–March 2021
Jackie Kleynhans , Stefano Tempia, Nicole Wolter, Anne von Gottberg, Jinal N. Bhiman, Amelia Buys, Jocelyn Moyes, Meredith L. McMorrow, Kathleen Kahn, F. Xavier Gómez-Olivé, Stephen Tollman, Neil A. Martinson, Floidy Wafawanaka, Limakatso Lebina, Jacques du Toit, Waasila Jassat, Mzimasi Neti, Marieke Brauer, Cheryl Cohen, and for the PHIRST-C Group1
Figure 4
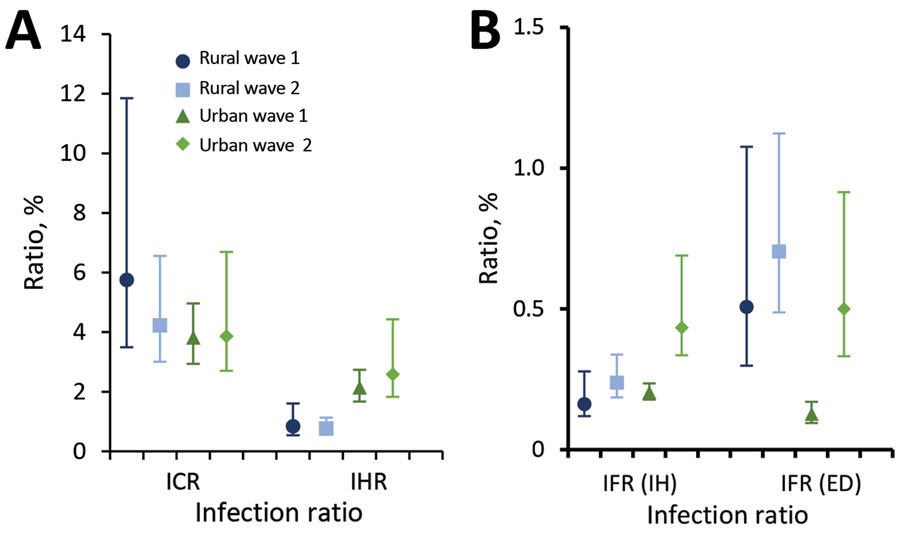
Figure 4. Severe acute respiratory syndrome coronavirus 2 infection–case and infection–hospitalization ratios (A) and in-hospital and excess deaths infection-fatality ratios (B) in a rural and urban community during the first and second wave of infections, South Africa, March 2020–March 2021. Vertical lines represent 95% CIs. Wave 1: March 1–November 21, 2020. Wave 2: November 2020 22–March 27, 2021. ED, excess deaths; ICR, infection–case ratio; IFR, infection–fatality ratio; IH, in-hospital; IHR, infection–hospitalization ratio.
1Additional members of the PHIRST-C group who contributed to this manuscript are listed at the end of this article.
Page created: August 30, 2021
Page updated: November 19, 2021
Page reviewed: November 19, 2021
The conclusions, findings, and opinions expressed by authors contributing to this journal do not necessarily reflect the official position of the U.S. Department of Health and Human Services, the Public Health Service, the Centers for Disease Control and Prevention, or the authors' affiliated institutions. Use of trade names is for identification only and does not imply endorsement by any of the groups named above.