Plasma MicroRNA Profiling of Plasmodium falciparum Biomass and Association with Severity of Malaria Disease
Himanshu Gupta
12
, Mercedes Rubio
1, Antonio Sitoe, Rosauro Varo, Pau Cisteró, Lola Madrid, Inocencia Cuamba, Alfons Jimenez, Xavier Martiáñez-Vendrell, Diana Barrios, Lorena Pantano, Allison Brimacombe, Mariona Bustamante, Quique Bassat
3, and Alfredo Mayor
3
Author affiliations: ISGlobal, Hospital Clinic—Universitat de Barcelona, Barcelona, Spain (H. Gupta, M. Rubio, R. Varo, P. Cisteró, A. Jimenez, X. Martiáñez-Vendrell, D. Barrios, A. Brimacombe, M. Bustamante, Q. Bassat, A. Mayor); Centro de Investigação em Saúde de Manhiça (CISM), Maputo, Mozambique (A. Sitoe, R. Varo, L. Madrid, I. Cuamba, Q. Bassat, A. Mayor); Spanish Consortium for Research in Epidemiology and Public Health (CIBERESP), Madrid, Spain (A. Jimenez, M. Bustamante, Q. Bassat, A. Mayor); Harvard T.H. Chan School of Public Health Department of Biostatistics, Boston, Massachusetts, USA (L. Pantano); Universitat Pompeu Fabra (UPF), Barcelona (M. Bustamante); I; nstitut Català de Recerca en Estudis Avançats (ICREA), Barcelona (Q. Bassat); Hospital Sant Joan de Déu—University of Barcelona Pediatrics Department, Barcelona (Q. Bassat)
Main Article
Figure 5
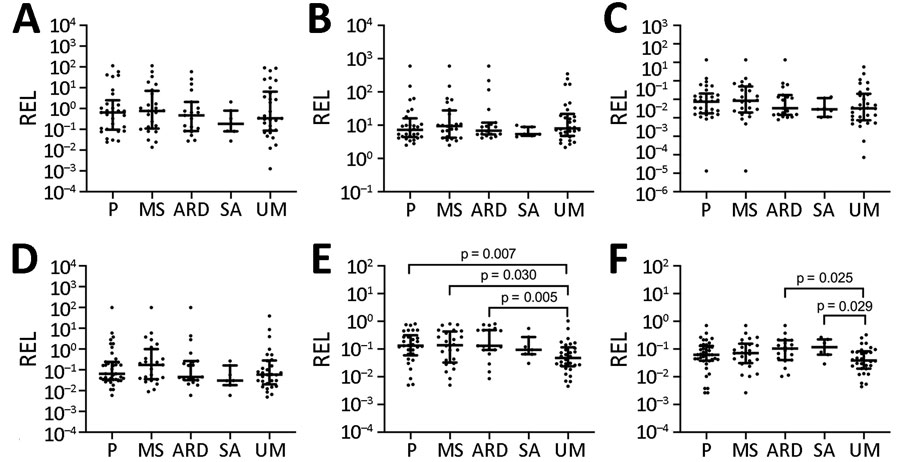
Figure 5. Association of microRNA levels with symptoms of severity in children with malaria, Mozambique, 2014. A) hsa-miR-122-5p; B) hsa-miR-320a; C) hsa-miR-1246; D) hsa-miR-1290; E) hsa-miR-3158-3p; F) hsa-miR-4497. RELs were calculated with respect to the mean of 2 endogenous controls (hsa-miR-30d-5p and hsa-miR-191–5p) and compared between children with UM and symptoms of severity. Distributions were compared using Mann-Whitney U test. Error bars represent medians and interquartile ranges. p values are shown for significant comparisons. ARD, acidosis or acute respiratory distress; MS, multiple seizures; P, prostration; REL, relative expression levels; SA, severe anemia; UM, uncomplicated malaria.
Main Article
Page created: December 10, 2020
Page updated: January 23, 2021
Page reviewed: January 23, 2021
The conclusions, findings, and opinions expressed by authors contributing to this journal do not necessarily reflect the official position of the U.S. Department of Health and Human Services, the Public Health Service, the Centers for Disease Control and Prevention, or the authors' affiliated institutions. Use of trade names is for identification only and does not imply endorsement by any of the groups named above.