Volume 27, Number 5—May 2021
Dispatch
Detecting COVID-19 Clusters at High Spatiotemporal Resolution, New York City, New York, USA, June–July 2020
Cite This Article
Citation for Media
Abstract
A surveillance system that uses census tract resolution and the SaTScan prospective space-time scan statistic detected clusters of increasing severe acute respiratory syndrome coronavirus 2 test percent positivity in New York City, NY, USA. Clusters included one in which patients attended the same social gathering and another that led to targeted testing and outreach.
Spatiotemporal analysis of high-resolution coronavirus disease (COVID-19) data can help health officials monitor disease spread and target interventions (1,2). Publicly available data have been used to detect COVID-19 spatiotemporal clusters at county and daily resolution levels across the United States (3; R. Amin et al., unpub. data, https://doi.org/10.1101/2020.05.22.20110155) and spatial clusters at ZIP code resolution in New York City (NYC), New York, USA (4).
For routine surveillance, the NYC Department of Health and Mental Hygiene (DOHMH) uses the case-only space-time permutation scan statistic (5) in SaTScan (https://www.satscan.org) to detect new outbreaks in the context of minimal or stable citywide incidence of reportable diseases (6) (e.g., Legionnaires’ disease [7] and salmonellosis [8]). Given wide testing variability, case-only analyses could be poorly suited for COVID-19 monitoring because true differences in disease rates across space and time would be indistinguishable from changing testing rates. We sought to detect in near real-time—regardless whether overall transmission was increasing, decreasing, or steady—newly emerging or re-emerging hotspots (i.e., areas where COVID-19 diagnoses, adjusted for the number of persons tested, were increasing or not decreasing as quickly relative to elsewhere in the city).
Clinical and commercial laboratories are required to report all severe acute respiratory syndrome coronavirus 2 (SARS-CoV-2) molecular test results (positive, negative, indeterminate) for New York state residents to the New York State Electronic Clinical Laboratory Reporting System (9). For NYC residents, this reporting system transmits reports to DOHMH. Laboratory reports include specimen collection date and patient demographics, including residential address, which we geocoded by census tract. Patient symptoms and illness onset date, if any, are obtained through interviews, although not all patients are interviewed.
To detect emerging clusters, the space-time scan statistic uses a cylinder in which the circular base covers a geographic area and the height corresponds to time (10). This cylinder is moved, or scanned, over space and time to cover different areas and periods. At each position, the number of cases inside the cylinder is compared with the expected count under the null hypothesis of no clusters by using a likelihood function, and the position with the maximum likelihood is the primary candidate for a cluster. The statistical significance of this cluster is then evaluated, adjusting for the multiple testing inherent in the many cylinder positions evaluated.
To quickly detect emerging hotspots, prospective analyses are conducted daily (11). To adjust for the multiple testing stemming from daily analyses, recurrence intervals are used instead of p values (12). A recurrence interval of D days means that under the null hypothesis, if we conduct the analysis repeatedly over D days, then the expected number of clusters of the same or larger magnitude is 1.
The space-time scan statistic can be used with different probability models; we used the Poisson model (10), adjusting not for population size (which would fail to account for changing testing rates) but rather for persons tested. Because the goal was to detect newly emerging hotspots rather than areas with consistently high percent positivity, we further adjusted analyses nonparametrically for purely geographic variations that were consistent over time. Fitting a log-linear function, we also adjusted for citywide temporal trends in percent positivity because the goal was to detect local hotspots rather than general citywide trends. For each day and location, the expected count was calculated as the number of persons tested × temporal trend function × a location-specific constant to ensure that, summed over all days in the study period, the location has the same number of observed and expected cases. To prioritize quickly emerging clusters to identify epidemiologic linkages, we used a short maximum temporal window of 7 days. To detect sustained clusters to inform place-based resource allocation, starting July 15, we also ran secondary analyses with a maximum temporal window of 21 days.
We developed SAS code (SAS Institute, https://www.sas.com; https://github.com/CityOfNewYork/communicable-disease-surveillance-nycdohmh) to generate daily input and parameter files (Table 1; Appendix Table). The SAS code then invoked SaTScan in batch mode, read analysis results back into SAS for further processing, output files to secured folders (including patient line lists with demographics and map and time-trend visualizations), and sent an investigator notification email.
Figure
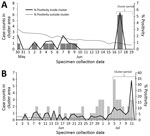
Figure. Cluster case counts and severe acute respiratory syndrome coronavirus 2 test percent positivity inside and outside cluster area for selected clusters detected in New York City, NY, USA, 2020. A)...
We launched the system on June 11, 2020, and 2 clusters detected by July 31 prompted public health action (Table 2). First, on June 22, in the context of waning case counts citywide, the only cluster detected was of 6 patients residing in a 0.6-km radius, all with specimens collected on June 17 (Figure, panel A). Consequently, DOHMH staff interviewed patients to collect and compare potential common exposures, such as attending the same event or visiting the same location. On June 23, a DOHMH surveillance investigator (D.B.) determined that 2 patients had attended the same gathering, where recommended social distancing practices had not been observed. In response, DOHMH launched an effort to limit further transmission, including testing, contact tracing, community engagement, and health education emphasizing the importance of isolation and quarantine. No other epidemiologic linkages were identified after attempts to investigate ≈65 additional clusters detected through July 2020. Second, detection on July 15 of a sustained cluster (lasting >1 week) with a high percent positivity (Figure, panel B) contributed to geographically targeted testing, outreach, and education, as part of NYC’s hyper-local plan to prevent COVID-19 transmission (14).
COVID-19 community clusters detected by SaTScan prompted localized public education, testing, and community engagement (15). In addition, prioritizing interviews of patients in clusters can identify epidemiologic linkages and opportunities for interrupting further transmission, as is done for other reportable diseases (6–8). Identification of only 1 linkage in this study could be attributable to changing cluster investigation protocols, low patient response rates, or transmission occurring diffusely in small gatherings. Because all patients are referred for contact tracing, DOHMH discontinued reactively interviewing cluster patients for linkages and instead used clusters to proactively target resources.
The first limitation in this study was timeliness. Analyses were based on specimen collection date; however, given delays in testing availability and care seeking, these dates did not necessarily represent recent infections. Timeliness was further limited by delays from specimen collection to laboratory testing and reporting. Clusters dominated by asymptomatic patients or patients with illness onset >14 days before diagnosis may not require intervention because positive PCR results indicate presence of viral RNA but not necessarily viable virus. The second limitation involved the need to geocode for spatial precision. Of unique NYC residents for whom a specimen was collected for SARS-CoV-2 RNA PCR testing during June–July 2020, residential address was not geocodable for ≈3% of residents, so they were excluded. Third, although recurrence interval thresholds can be used to prioritize responding to clusters (6), COVID-19 cluster interpretation can be more complex. Other characteristics for prioritizing COVID-19 clusters, besides statistical significance, include percent positivity, relative risk, case count, epidemic curve trajectory, radius, demographics, and persistence. Prioritization can differ by response activity (e.g., establishing new testing sites, conducting outreach) and how quickly resources can be reallocated. Deciding when and where to initiate interventions in response to COVID-19 clusters cannot be fully automated and requires epidemiologic interpretation.
In summary, our COVID-19 early detection system highlighted areas warranting a rapid response. Targeted, place-based approaches for education and outreach efforts and for localized high transmission warnings could better protect persons at high risk for severe illness and death.
Dr. Greene is the director of the Data Analysis Unit at the Bureau of Communicable Disease of the NYC DOHMH, Long Island City, New York. Her research interests include infectious disease epidemiology and applied surveillance methods for outbreak detection.
Acknowledgments
We thank all staff members of the DOHMH Incident Command System Surveillance and Epidemiology Section for processing, cleaning, and managing input data; for conducting patient interviews and cluster investigations; and for logistical support. We also thank the NYC Test and Trace Corps for their assistance in managing the cases and contacts included in and identified by cluster investigations.
S.K.G. and E.R.P were supported by the Public Health Emergency Preparedness Cooperative Agreement (grant NU90TP922035-01), funded by the Centers for Disease Control and Prevention (CDC). M.K. was supported by the SaTScan Enhancements Project, managed by the Fund for Public Health in New York City and funded by the CDC Foundation, CDC ELC CARES (grant NU50CK000517-01-09), Alfred P. Sloan Foundation, and Open Society Foundations.
References
- De Ridder D, Sandoval J, Vuilleumier N, Stringhini S, Spechbach H, Joost S, et al. Geospatial digital monitoring of COVID-19 cases at high spatiotemporal resolution. Lancet Digit Health. 2020;2:e393–4. DOIPubMedGoogle Scholar
- Furuse Y, Sando E, Tsuchiya N, Miyahara R, Yasuda I, Ko YK, et al. Clusters of coronavirus disease in communities, Japan, January–April 2020. Emerg Infect Dis. 2020;26:2176–9. DOIPubMedGoogle Scholar
- Hohl A, Delmelle EM, Desjardins MR, Lan Y. Daily surveillance of COVID-19 using the prospective space-time scan statistic in the United States. Spat Spatio-Temporal Epidemiol. 2020;34:
100354 . DOIPubMedGoogle Scholar - Cordes J, Castro MC. Spatial analysis of COVID-19 clusters and contextual factors in New York City. Spat Spatio-Temporal Epidemiol. 2020;34:
100355 . DOIPubMedGoogle Scholar - Kulldorff M, Heffernan R, Hartman J, Assunção R, Mostashari F. A space-time permutation scan statistic for disease outbreak detection. PLoS Med. 2005;2:
e59 . DOIPubMedGoogle Scholar - Greene SK, Peterson ER, Kapell D, Fine AD, Kulldorff M. Daily reportable disease spatiotemporal cluster detection, New York City, New York, USA, 2014–2015. Emerg Infect Dis. 2016;22:1808–12. DOIPubMedGoogle Scholar
- Weiss D, Boyd C, Rakeman JL, Greene SK, Fitzhenry R, McProud T, et al.; South Bronx Legionnaires’ Disease Investigation Team. A large community outbreak of Legionnaires’ disease associated with a cooling tower in New York City, 2015. Public Health Rep. 2017;132:241–50. DOIPubMedGoogle Scholar
- Latash J, Greene SK, Stavinsky F, Li S, McConnell JA, Novak J, et al. Salmonellosis outbreak detected by automated spatiotemporal analysis—New York City, May–June 2019. MMWR Morb Mortal Wkly Rep. 2020;69:815–9. DOIPubMedGoogle Scholar
- New York State Department of Health. Health advisory: reporting requirements for all laboratory results for SARS-CoV-2, including all molecular, antigen, and serological tests (including “rapid” tests) and ensuring complete reporting of patient demographics [cited 2020 Jun 24]. https://coronavirus.health.ny.gov/system/files/documents/2020/04/doh_covid19_reportingtestresults_rev_043020.pdf
- Kulldorff M, Athas WF, Feurer EJ, Miller BA, Key CR. Evaluating cluster alarms: a space-time scan statistic and brain cancer in Los Alamos, New Mexico. Am J Public Health. 1998;88:1377–80. DOIPubMedGoogle Scholar
- Kulldorff M. Prospective time-periodic geographical disease surveillance using a scan statistic. J R Stat Soc Ser A Stat Soc. 2001;164:61–72. DOIGoogle Scholar
- Kleinman K, Lazarus R, Platt R. A generalized linear mixed models approach for detecting incident clusters of disease in small areas, with an application to biological terrorism. Am J Epidemiol. 2004;159:217–24. DOIPubMedGoogle Scholar
- Levin-Rector A, Nivin B, Yeung A, Fine AD, Greene SK. Building-level analyses to prospectively detect influenza outbreaks in long-term care facilities: New York City, 2013-2014. Am J Infect Control. 2015;43:839–43. DOIPubMedGoogle Scholar
- NYC Health + Hospitals. Mayor de Blasio expands hyper-local testing response in Sunset Park, Brooklyn [cited 2020 Nov 27]. https://www.nychealthandhospitals.org/pressrelease/mayor-de-blasio-expands-hyper-local-testing-response-in-sunset-park
- Stack L, Goldstein J. How a virus surge among Orthodox Jews became a crisis for New York. https://www.nytimes.com/2020/10/08/nyregion/orthodox-jews-queens-brooklyn-closures.html
Figure
Tables
Cite This ArticleOriginal Publication Date: April 12, 2021
Table of Contents – Volume 27, Number 5—May 2021
| EID Search Options |
|---|
|
|
|
|
|
|
Please use the form below to submit correspondence to the authors or contact them at the following address:
Sharon K. Greene, New York City Department of Health and Mental Hygiene, 42-09 28th St, CN 22A, WS 06-154, Long Island City, NY 11101, USA
Top