Volume 27, Number 5—May 2021
Synopsis
Coccidioidomycosis and COVID-19 Co-Infection, United States, 2020
Alexandra K. Heaney, Jennifer R. Head, Kelly Broen, Karen Click, John Taylor, John R. Balmes, Jon Zelner, and Justin V. Remais
Figure 2
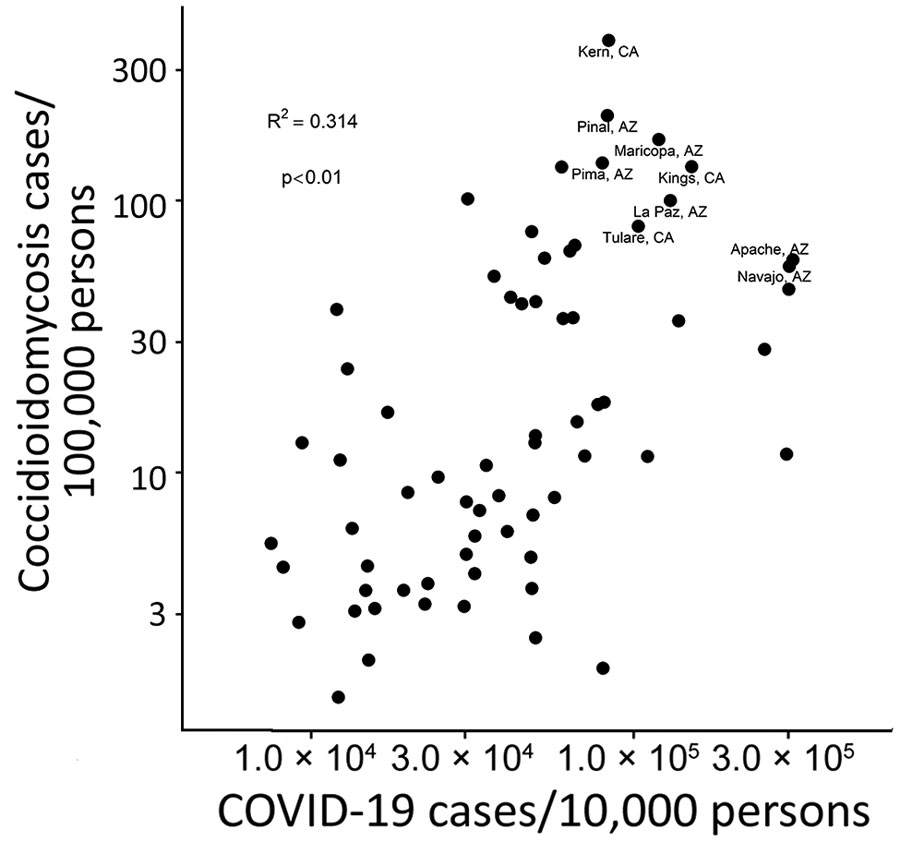
Figure 2. Scatterplot of county-level incidence of COVID-19 in 2020 and coccidioidomycosis in 2019, California and Arizona. R2 = 0.259; p<0.01.
Page created: March 02, 2021
Page updated: April 20, 2021
Page reviewed: April 20, 2021
The conclusions, findings, and opinions expressed by authors contributing to this journal do not necessarily reflect the official position of the U.S. Department of Health and Human Services, the Public Health Service, the Centers for Disease Control and Prevention, or the authors' affiliated institutions. Use of trade names is for identification only and does not imply endorsement by any of the groups named above.