Volume 27, Number 5—May 2021
Research
Clinical Evaluation of Roche SD Biosensor Rapid Antigen Test for SARS-CoV-2 in Municipal Health Service Testing Site, the Netherlands
Figure 1

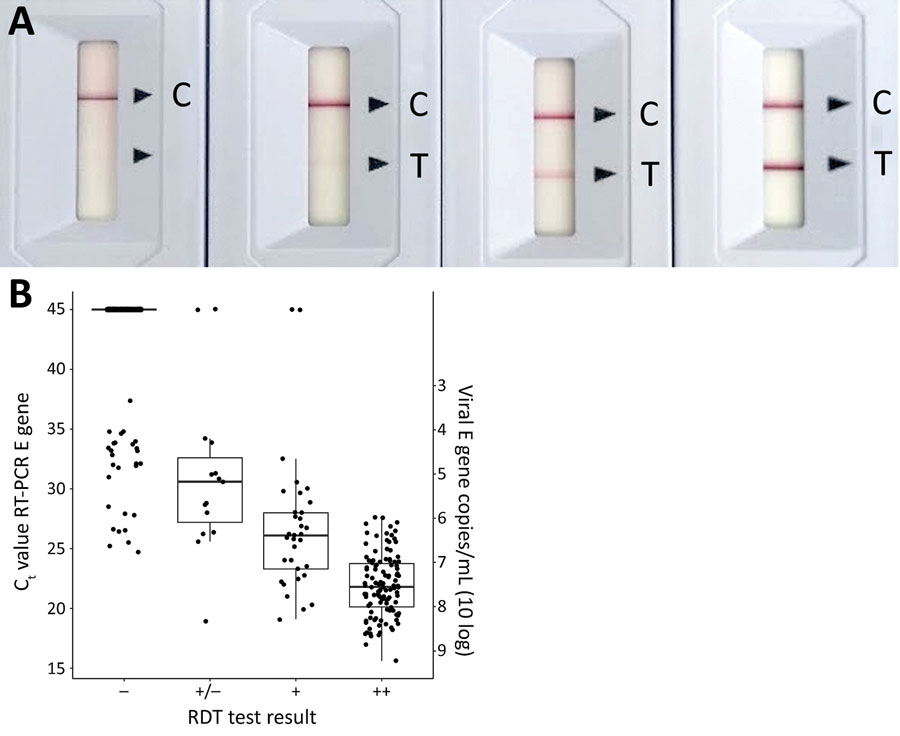
Figure 1. Comparison of results for rapid antigen detection tests and PCR for diagnosis of severe acute respiratory syndrome coronavirus 2, the Netherlands. A) Example of the 4 grade scaling system used for result readout. Results were determined by the absence or presence of the T band as well as band intensity. An absent T band is read as negative. Positive results were further distinguished as follows: very faint band, +/−; medium intensity band, +; and strong band, ++. Final readout of results was done after the manufacturer’s recommended 15 minutes. B) Correlation of RT-PCR Ct and Ag RDT test band intensity. RT-PCR Ct results were grouped by the 4 categories of the Ag RDT result readout (n = 970). Horizontal line in each box indicates median Ct; box borders indicate 75% interquartile range (IQR), whiskers represent the range of values 1.5 times the IQR, and dots represent individual test results. Ag RDT, antigen rapid detection test; C, control; Ct, cycle threshold; E gene, envelope gene; RT-PCR, reverse transcription pPCR; T, test; −, negative; +/− weak positive; +, positive; ++, strong positive.