Volume 27, Number 7—July 2021
Research
Transmission Dynamics of African Swine Fever Virus, South Korea, 2019
Figure 5
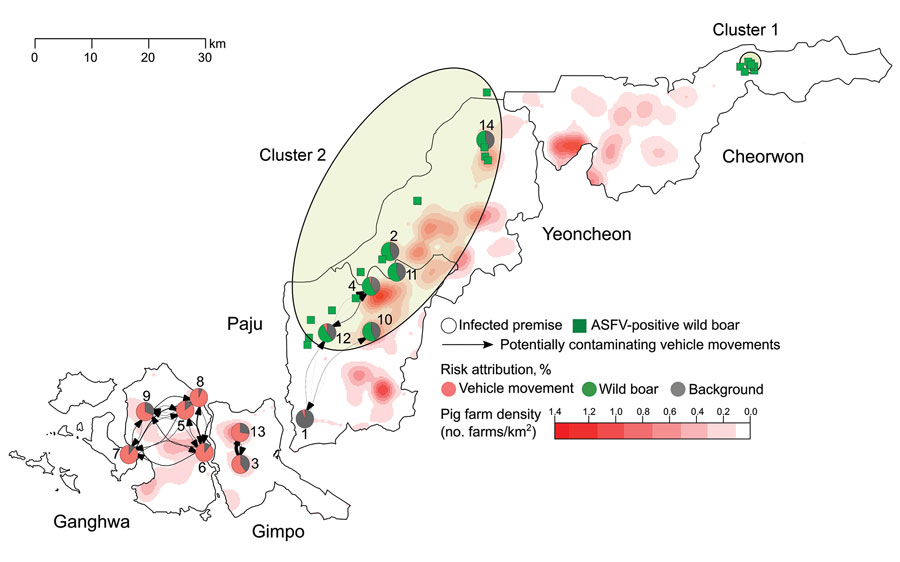
Figure 5. Spatial distribution of infected premises (IPs), non-IPs, African swine fever virus (ASFV)–positive wild boars, and potentially contaminating vehicle movements between IPs, South Korea, 2019. The duration of vehicle infectiousness was set to 3 days. Circles represent IPs; numbers represent the order of reporting dates. Pie charts show the estimated contribution of different transmission routes to the infection of each IP. Edge width is proportional to the number of potentially contaminating vehicle movements between IPs, weighted by the probability that an exit IP was infectious at the time of the vehicle departure. Edge arrows represent the direction of vehicle movements. Pig farm density is shown in reddish colors. Green squares represent the location of ASFV-positive wild boars; green-shaded ellipses represent spatial clusters.
1These authors contributed equally to this article.