Volume 27, Number 9—September 2021
Research
Patterns of Virus Exposure and Presumed Household Transmission among Persons with Coronavirus Disease, United States, January–April 2020
Rachel M. Burke , Laura Calderwood, Marie E. Killerby, Candace E. Ashworth, Abby L. Berns, Skyler Brennan, Jonathan M. Bressler, Laurel Harduar Morano, Nathaniel M. Lewis, Tiffanie M. Markus, Suzanne M. Newton, Jennifer S. Read, Tamara Rissman, Joanne Taylor, Jacqueline E. Tate, Claire M. Midgley, and for the COVID-19 Case Investigation Form Working Group
Figure 2
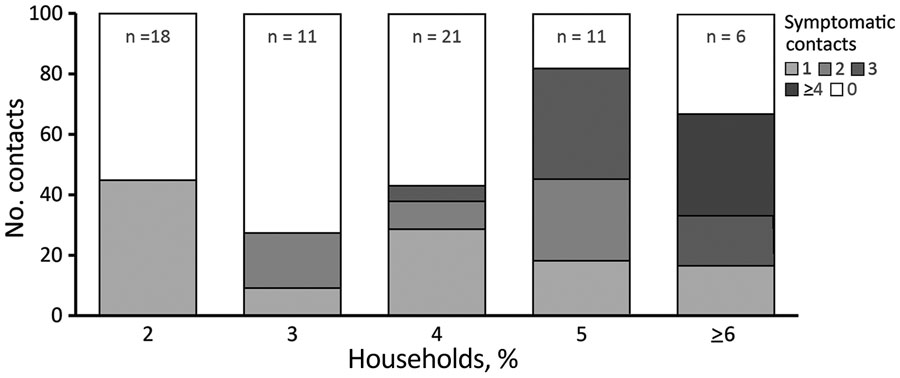
Figure 2. Proportion of households with presumed severe acute respiratory syndrome coronavirus 2 transmission, by household size (including index case-patient), United States, January–April 2020. Shading indicates percentage of households with the specified number of symptomatic household contacts (i.e., excluding index case-patient); households with zero symptomatic contacts (in white) are those in which presumed household transmission did not occur. n = no. households in each stratum.
Page created: June 21, 2021
Page updated: August 17, 2021
Page reviewed: August 17, 2021
The conclusions, findings, and opinions expressed by authors contributing to this journal do not necessarily reflect the official position of the U.S. Department of Health and Human Services, the Public Health Service, the Centers for Disease Control and Prevention, or the authors' affiliated institutions. Use of trade names is for identification only and does not imply endorsement by any of the groups named above.