Volume 28, Number 1—January 2022
Research
Transmission Dynamics of Large Coronavirus Disease Outbreak in Homeless Shelter, Chicago, Illinois, USA, 2020
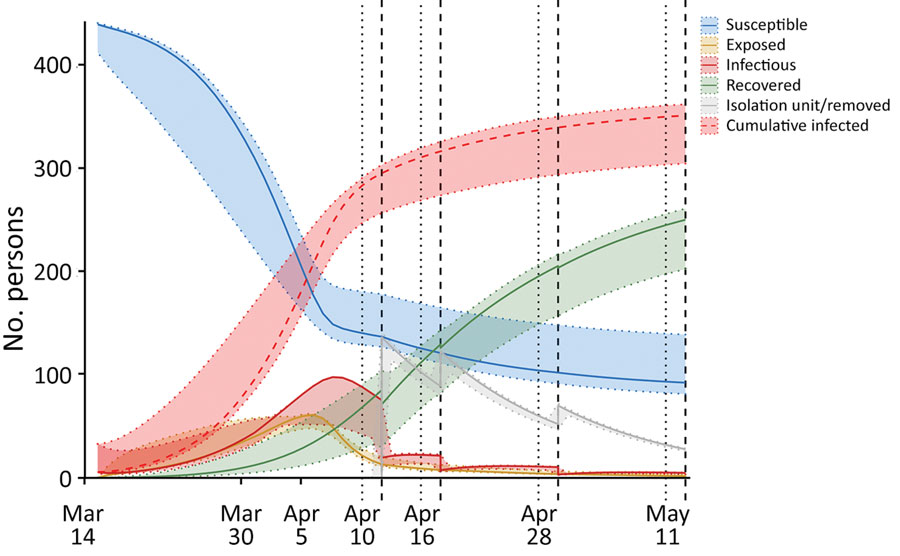
Figure 4

Figure 4. Compartmental modeling results of the coronavirus disease outbreak at Pacific Garden Mission, a homeless shelter in Chicago, Illinois, USA, 2020. The 4 phases of the outbreak are designated above the graph, and time points corresponding to each of the 4 rounds of mass testing and isolation are indicated by vertical dotted lines and vertical dashed lines. The susceptible compartment corresponds to persons who are estimated to have never been infected; exposed persons have been infected but are not yet infectious; infectious includes persons in both Is and Ia; recovered include the R+s, R+a, and R– compartments; isolation unit/removed persons tested positive by reverse transcription PCR and either left the shelter or were moved to isolation units. The discontinuities in the isolation unit/removed, infectious, and recovered curves at each of the isolation time points (dotted lines) represent persons who tested positive by reverse transcription PCR (those in the Is, Ia, R+s, and R+a compartments) at the respective testing time point (dashed lines) being moved to the Isolation Unit compartment with each of the 4 rounds of mass testing. The 95% CIs for the compartments represent maximum and minimum values for each trajectory when reperforming model optimization with β0 (initial transmission rate) fixed over its 95% CI (0.45–0.74) derived from initial model optimization (β0 = 0.60). Corresponding description of compartments, systems of ordinary differential equations, and parameter descriptions are described in detail in the Appendix.
1These senior authors contributed equally to this article.