Volume 28, Number 1—January 2022
Dispatch
Use of Private Sector Workforce Respiratory Disease Short-Term Disability Claims to Assess SARS-CoV-2, Mexico, 2020
Cite This Article
Citation for Media
Abstract
We examined respiratory disease short-term disability claims submitted to the Mexican Social Security Institute during 2020. A total of 1,631,587 claims were submitted by 19.1 million insured workers. Cumulative incidence (8.5%) was 3.6 times higher than that for January 2015‒December-2019. Workers in healthcare, social assistance, self-service, and retail stores were disproportionately affected.
During February 28–December 31, 2020, Mexico officially reported 1.8 million coronavirus disease (COVID-19) cases and 326,612 all-cause excess deaths (representing a 45.1% excess of total expected deaths for the time period) (1). Surveillance in Mexico is based on sentinel sampling capturing a systematic subset of COVID-19 cases, with limited access to widespread testing (2). Despite concern for health outcomes among healthcare workers, studies examining the effects of COVID-19 across different occupational groups are lacking. To describe the severe acute respiratory syndrome coronavirus 2 (SARS-CoV-2) epidemic among private-sector workers, we analyzed respiratory disease short-term disability claims (RD-STDC) submitted during 2020 to the Mexican Social Security Institute (Spanish acronym IMSS) by 19.1 million workers insured by the IMSS.
We extracted workers’ social security number, age, sex, start date, duration of temporary disability, and clinical diagnosis (International Classification of Diseases, 10th Revision‒, codes for COVID-19 [U070, U071, U072, U07E, U07S, B342, and B972], acute respiratory diseases [J01, J04-J06, J20, and J21], influenza [(J10, J11], pneumonia [J12‒J18], and other [J029, J00X, J02X, J039, and J22X]) from the IMSS STDC database for 2015─2020. We then linked workers through their social security number to their employer’s activity, sector, and subsector and to IMSS registries for SARS-CoV-2 testing information (real-time PCR).
We described RD-STDC by using weekly rates per 10,000 workers and plotted the claims by epidemiologic week and by economic sector and subsector. We use industry sectors (subsectors) included in the North American Industry Classification System (NAICS) codes: agriculture, forestry, fishing, and hunting (NAICS-Sector 11); mining, quarrying, and oil and gas extraction (NAICS-Sector 21); manufacturing (NAICS-Sectors 31–33), food manufacturing, textile mills, transportation equipment, computer and electronic products; construction (NAICS-Sector 23), retail trade (NAICS-Sectors 44 and 45), food and beverage stores, general merchandise stores, self-service and retail stores); communications and transportation (NAICS-Sectors 48 and 49); services for companies, homes, and people (NAICS-Sectors 56 and 72, accommodation, food services, and drinking places); and social and community services (NAICS-Sectors 61, 62, and 71, educational services, arts, entertainment, and recreation, health care and social assistance).
We evaluated RD-STDC outbreak severity by using the moving epidemic method (3) to estimate epidemic threshold and epidemic intensity (EI) level (i.e., low, medium, high, and very high) for the 2015–2019 winter seasons. We defined the epidemic threshold by the 1-sided 95% CI around the arithmetic mean of the 30 highest preepidemic/postepidemic weekly rates and the EI (low, medium, high and very high intensity) by using the 1-sided 95% CI around the geometric mean of 30 highest weekly epidemic rates. We set CI limits at 40%, 90%, and 97.5%.
We estimated industry-, sector- and subsector-specific cumulative RD-STDC incidence by dividing the sum of RD-STDC by the worker population registered at IMSS for each year and compared 2015–2019 (baseline) with 2020 by using risk ratios. Cumulative COVID-19 incidence was calculated by applying the percentage of workers with a positive SARS-CoV-2 test with the RD-STDC weekly number and dividing the cumulative sum of COVID-19 cases (n = 1,029,122) by the worker population. We calculated lost workdays (LWDs) by adding all authorized days and excess LWDs as the observed minus the expected number of LWDs in weeks above the threshold (90th percentile) for each week. We calculated proportions of LWD rates by dividing the number of workdays lost to RD-STDC per year by the total number of available workdays. This project was deemed a public health surveillance and did not require institutional review board approval. We used Stata version 15.1 (https://www.stata.com) for all graphical and statistical analyses.
Figure 1
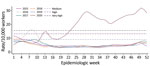
Figure 1. Annual incidence rates of work absenteeism related to respiratory diseases short-term disability claims per 10,000 workers for workers insured by the Mexican Social Security Institute, by epidemiologic week, Mexico, 2015–2020....
Figure 2
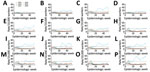
Figure 2. Annual incidence rate of work absenteeism related to respiratory diseases short-term disability claims per 10,000 workers for workers in selected industry sectors (A‒H) and subsectors (I‒P) insured by the Mexican...
Among 19.1 million insured workers (mean age 36.9 years, 61.5% males), we identified 1,631,587 workers with an RD-STDC (53.4% males, mean age 35.1 years, interquartile range 26.0–43.3 years). Weekly RD-STDC rates increased sharply (Figure 1) and reached a medium EI (first peak 35,707 RD-STDC reported); claims decreased but remained above medium EI level until May, when the slope increased to a maximum in week 29 (July 18, second peak 62,542 RD-STDC reported), crossing into the EI level of very high intensity. From this date, RD-STDC frequency decreased but remained 5‒6 times higher than historical values until week 38 (September 13), when RD-STDC increased, reaching a third peak (71,785 RD-STDC reported) during week 51 (December 20). Up to week 53, a total of 1,543,600 cumulative RD-STDC were reported, with an estimated cumulative incidence of 8.0%. The EI of epidemic curves varied by industry sector and subsector (Figure 2).
A total of 20% of workers who had an RD-STDC were tested for SARS-CoV-2; 59% were positive. The estimated number of symptomatic COVID-19 cases among IMSS-affiliated workers was 910,073 (cumulative incidence 5%). The median RD-STDC granted was 10 days (interquartile range 4–14 days), representing an excess of 17.4 million workdays lost compared with that during 2015‒2019.
We compiled the cumulative RD-STDC incidence for different industry sectors (Table), which ranged from 3% for agriculture, forestry, fishing, and hunting to 10% for retail trade and manufacturing. When we compared these data with those for 2015–2019, we found that the total RD-STDC during 2020 were 2.9‒5.0 times higher in all sectors. The amounts of total workdays lost (WDL) attributed to RD-STDC (Appendix Table) were highest among the manufacturing sector (0.44%; WDL 6.10 million). Among subsectors, WDL ranged from 0.14% (WDL 0.24 million) for educational services, arts, entertainment, and recreation to 0.80% (WDL 0.64 million) for health care and social assistance.
Workers in multiple industry sectors and subsectors were disproportionately affected by the SARS-CoV-2 pandemic. The above-average cumulative incidence of RD-STDC among some subsectors suggests an occupational link to infection. Healthcare workers had a high cumulative RD-STDC incidence (15.6%). This incidence was similar for persons who worked near or frequently with other workers or who have frequent customer contact but are not exposed to SARS-CoV2 directly, such as workers in manufacturing, food, and retail. In contrast, lower attack rates were observed within the educational services, arts, entertainment, and recreation subsectors. In Mexico, after their closure on March 16, 2020, schools continued with distance learning activities until August 30, 2021, when in-person instruction was reestablished.
Real-time analysis of RD-STDC by sector and subsector enables detection of outbreaks and rapid implementation of mitigation measures such as contact tracing, reinforcing hand hygiene, universal masking, and social distancing. RD-STDC rates might also be used to guide vaccination priorities aimed at protecting workers at higher risk for infection.
Our study’s first limitation is that COVID-19 cases among workers might have been underestimated because not all symptomatic workers requested RD-STDC. In a recent serosurvey of IMSS insured workers, 26%‒40% of workers with SARS-CoV-2 antibodies and symptoms compatible with COVID-19 sought RD-STDC (D. Barros-Sierra Cordero et al., IMSS, pers. comm., 2021 Jan 10), suggesting that real symptomatic COVID-19 attack rates could be 3‒4 times higher. Second, asymptomatic or minimally symptomatic workers infected with SARS-CoV-2 are not reflected in this analysis. Third, some RD-STDCs might have been related to diseases other than COVID-19. Fourth, not all workers included in our denominator sought care within IMSS facilities, leading to incomplete capture of RD-STDC and a potential underestimation of the magnitude of the epidemic. Fifth, we did not examine geographic differences in RD-STDC claims. It is possible that economic sectors and subsectors less affected were concentrated in areas of low epidemic intensity in the country, resulting in lower RD-STDC rates, which could account for the low rates observed in agriculture, forestry, fishing, and hunting.
Predictive models based on the RD-STDC surveillance system are currently used by the IMSS to alert large manufacturing sites and other businesses of possible workplace outbreaks. Information provided by this system complements other surveillance systems for monitoring epidemics and inform decision-making by health authorities. Our data highlight the need for including respiratory disease claims in pandemic preparedness planning.
Dr. Hernandez-Avila is an epidemiologist and director of Economic and Social Benefits of the Mexican Social Security Institute, Mexico City, Mexico. His primary research interests are occupational health and disease prevention.
Acknowledgment
This study was supported by the IMSS of Mexico.
References
- Palacio Mejía LS, Wheatley Fernández JL, Ordoñez Hernández I, López Ridaura R, Lopez-Gatell Ramirez H, Hernandez Avila M, et al. Inter-institutional group for estimating excess mortality: estimation of excess mortality from all causes during the COVID-19 pandemic in Mexico [in Spanish]. Salud Publica Mex. 2021;63:211–24.PubMedGoogle Scholar
- General Directorate of Epidemiology, Undersecretary of Prevention and Health Promotion. Health Secretary. Standardized guideline for epidemiological and laboratory surveillance of viral respiratory disease, April 2020 [in Spanish] [cited 2021 Oct 5]. https://coronavirus.gob.mx
- Vega T, Lozano JE, Meerhoff T, Snacken R, Beauté J, Jorgensen P, et al. Influenza surveillance in Europe: comparing intensity levels calculated using the moving epidemic method. Influenza Other Respir Viruses. 2015;9:234–46. DOIPubMedGoogle Scholar
Figures
Table
Cite This ArticleTable of Contents – Volume 28, Number 1—January 2022
| EID Search Options |
|---|
|
|
|
|
|
|