Volume 28, Number 4—April 2022
Research
Genomic Epidemiology of Early SARS-CoV-2 Transmission Dynamics, Gujarat, India
Figure 1
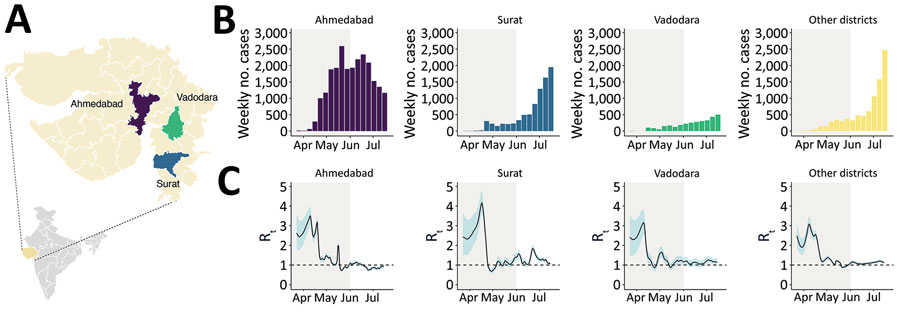
Figure 1. COVID-19 epidemiology during the first epidemic wave, Gujarat, India, 2020. A) Gujarat, highlighting the 3 most populous districts. Purple indicates Ahmedabad, blue indicates Surat, green indicates Vadodara, and yellow indicates all other districts. Inset map shows location of Gujarat in India. B) Weekly counts of newly reported cases of infection with COVID-19 for Ahmedabad, Surat, Vadodara, and other districts during April‒July 2020. C) Estimates of Rt for 4 locations on the basis of daily incidence data using 7-day averaging (see Methods). The black line indicates the median estimate, the blue shaded region indicates 95% equal-tailed Bayesian credible intervals, and the gray shaded region indicates the period of national lockdown. The dotted line indicates Rt = 1. COVID-19, coronavirus disease; Rt, epidemic instantaneous reproduction number.
1These senior authors contributed equally to this article.