Volume 28, Number 4—April 2022
Research
Genomic Epidemiology of Early SARS-CoV-2 Transmission Dynamics, Gujarat, India
Figure 3
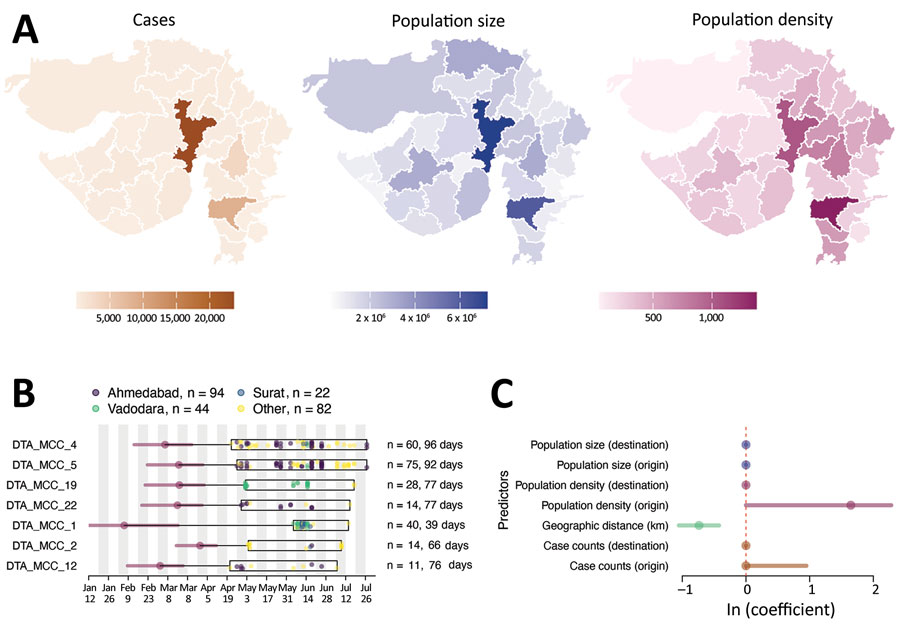
Figure 3. Determinants of SARS-CoV-2 lineage spread, Gujarat, India. A) Choropleth maps of key predictors (left, no. cases; middle, population size; right, population density, persons per square kilometer) that were evaluated in the phylogeographic generalized linear model analysis along with geographic distance. B) tMRCA and sample distribution of the 7 largest transmission lineages. For each lineage, circles correspond to the estimated lineage tMRCA, and horizontal bars indicate the 95% highest posterior density interval of the tMRCA. Box indicates date range of the samples from Gujarat for each lineage. Total number of samples and duration of each lineage are shown on the right. C) Predictors of SARS-CoV-2 lineage movement in Gujarat on the basis of 20 sampled districts. The contribution of each predictor is indicated by the mean coefficient value (points) and 95% highest posterior density interval (horizontal bars). tMRCA, time to most recent common ancestor. SARS-CoV-2, severe acute respiratory syndrome coronavirus 2.
1These senior authors contributed equally to this article.