Volume 28, Number 6—June 2022
Synopsis
Foodborne Illness Outbreaks Reported to National Surveillance, United States, 2009–2018
Figure 1

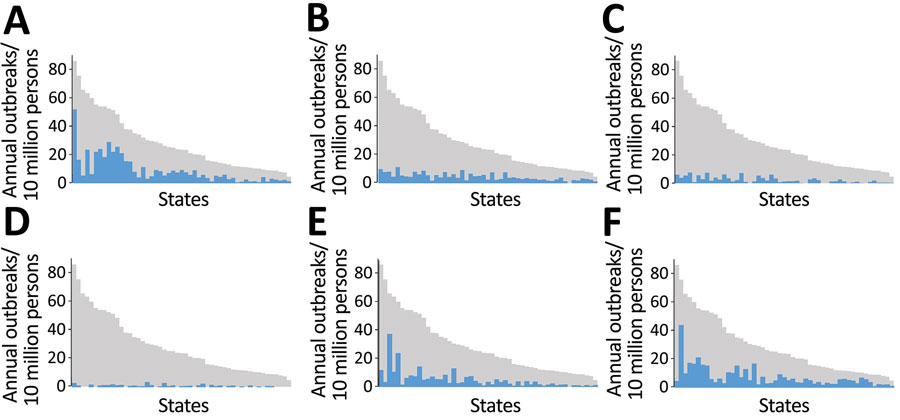
Figure 1. Mean annual rates of foodborne disease outbreaks reported to the Centers for Disease Control and Prevention per 10 million population by etiology and US state (deidentified), Foodborne Disease Outbreak Surveillance System, United States, 2009–2018. Blue bars represent outbreaks reported for the specified etiology. Gray bars represent all outbreaks reported. Blue and gray bars correspond to the same reporting jurisdiction and are ordered by reporting rate for all single-state outbreaks. A) Norovirus; B) Salmonella; C) bacterial toxins; D) Shiga toxin–producing E. coli O157; E) Other known cause; F) Unknown cause.
Page created: April 13, 2022
Page updated: May 22, 2022
Page reviewed: May 22, 2022
The conclusions, findings, and opinions expressed by authors contributing to this journal do not necessarily reflect the official position of the U.S. Department of Health and Human Services, the Public Health Service, the Centers for Disease Control and Prevention, or the authors' affiliated institutions. Use of trade names is for identification only and does not imply endorsement by any of the groups named above.