Volume 28, Number 6—June 2022
Synopsis
Foodborne Illness Outbreaks Reported to National Surveillance, United States, 2009–2018
Cite This Article
Citation for Media
Abstract
Foodborne outbreaks reported to national surveillance systems represent a subset of all outbreaks in the United States; not all outbreaks are detected, investigated, and reported. We described the structural factors and outbreak characteristics of outbreaks reported during 2009–2018. We categorized states (plus DC) as high (highest quintile), middle (middle 3 quintiles), or low (lowest quintile) reporters on the basis of the number of reported outbreaks per 10 million population. Analysis revealed considerable variation across states in the number and types of foodborne outbreaks reported. High-reporting states reported 4 times more outbreaks than low reporters. Low reporters were more likely than high reporters to report larger outbreaks and less likely to implicate a setting or food vehicle; however, we did not observe a significant difference in the types of food vehicles identified. Per capita funding was strongly associated with increased reporting. Investments in public health programming have a measurable effect on outbreak reporting.
Foodborne diseases remain a major public health challenge in the United States, where 31 known pathogens cause an estimated 9 million illnesses, 56,000 hospitalizations, and 1,300 deaths annually (1). Efforts to improve food safety and reduce the burden of foodborne disease rely on data from foodborne disease surveillance and outbreak investigations to help prioritize food safety interventions, policies, and practices. Data from foodborne illness outbreaks reported to the Centers for Disease Control and Prevention (CDC) provide vital information on the foods causing illness and common food–pathogen pairs. Those data are used by the Interagency Food Safety Analytics Collaboration (IFSAC) to inform outbreak-based attribution models that attribute illnesses to specific food categories (2,3).
Foodborne illness outbreaks are investigated by local, state, and territorial health departments, CDC, the US Food and Drug Administration (FDA), and the Food Safety and Inspection Service of the United States Department of Agriculture and are reported to CDC’s Foodborne Disease Outbreak Reporting Surveillance System (FDOSS) through the web-based National Outbreak Reporting System (NORS). Although reported outbreaks are a rich data source, they represent a subset of all outbreaks occurring in the United States; not all outbreaks will be detected, investigated, and reported. Factors influencing which outbreaks are detected, investigated, and reported to CDC include both structural factors associated with the jurisdiction in which the outbreak occurred (e.g., infrastructure and capacity) and characteristics of the outbreak (e.g., size, geographic location, pathogen).
We integrated data from a variety of sources to examine structural factors and describe outbreak characteristics of foodborne outbreaks involving Salmonella, Shiga toxin–producing Escherichia coli (STEC) O157, norovirus, and bacterial toxins that were reported to national surveillance. In addition, we assessed the effects of state variation in outbreak reporting on the types of food vehicles identified.
Foodborne Outbreak Data
We obtained outbreak surveillance data from CDC’s FDOSS for 2009–2018, extracted November 22, 2019. This passive surveillance system receives outbreak reports from state, local, and territorial health agencies using a standard outbreak report form that includes information on the date and location of the outbreak, investigation methods, case demographics, etiology, transmission route, setting, and implicated food, among other variables. Forms have been submitted electronically through NORS since 2009. For this study, we included all single-state foodborne outbreaks (exposures occurred in 1 state) reported to FDOSS by 50 states and Washington, DC. We excluded multistate outbreaks (exposures occurred in multiple states) because there are relatively few multistate outbreaks, and single-state outbreaks are more reflective of individual state resources and capacity. We included city jurisdictions reporting independently in state totals. When categorizing outbreaks by pathogen, we included any outbreaks with a confirmed or suspected etiology of Salmonella, STEC O157, norovirus, and bacterial toxins (Clostridium perfringens, Bacillus cereus, and Staphylococcus aureus). Outbreaks associated with other priority IFSAC pathogens, including Campylobacter spp. and Listeria monocytogenes were not included in pathogen-specific analyses because few outbreaks were reported. We included outbreaks caused by multiple pathogens in all outbreaks and excluded them from pathogen group analysis.
We calculated outbreak reporting rates as the number of single-state foodborne illness outbreaks reported annually per 10 million population for 2009–2018, averaged over time by state. We categorized states by outbreak reporting quintile for all etiologies, then collapsed into high (the highest outbreak reporting quintile), middle (the middle 3 quintiles), or low (the lowest quintile) reporting groups. We compared high, middle, and low outbreak reporting over time and by the structural and outbreak characteristics described using bivariate χ2, Kruskal-Wallis, or Fisher exact test as appropriate. We analyzed data using SAS version 9.4 (SAS Institute Inc., https://www.sas.com). This analysis did not meet the definition of human subjects research as defined in the US Code of Federal Regulations, Title 45 Part 46, and was not subject to review by an institutional review board.
Structural Characteristics
Structural characteristics related to state reporters were available from a variety of sources and included reporting structure, funding sources, and participation in foodborne or environmental health programs. Reporters were classified as having a centralized surveillance reporting structure, in which state health departments were the primary leaders of surveillance and outbreak investigations, or decentralized structure, in which local health departments were the primary leaders of surveillance and outbreak investigations using the 2014 LawAtlas codebook for state foodborne illness reporting laws and the 2007 Enteric Disease Outbreak Investigation and Surveillance survey (4,5). Funding sources we examined included the total number of public health full-time employees (FTEs) and state public health revenue by source, available from the Association of State and Territorial Health Officials (ASTHO) Profile of State and Territorial Public Health reports (https://www.astho.org); Epidemiology and Laboratory Capacity for Prevention and Control of Emerging Infectious Diseases (ELC) cooperative-agreement funding for fiscal years 2016–2018, which funded states and territories to detect, respond to, control, and prevent infectious diseases (6); and federal foodborne or environmental health programs. ELC-funded state programs for foodborne illness detection and response include the Integrated Food Safety Centers of Excellence (CoE; https://www.cdc.gov/foodsafety/centers), Foodborne Diseases Centers for Outbreak Response Enhancement (FoodCORE; https://www.cdc.gov/foodcore), and OutbreakNet Enhanced (OBNE, https://www.cdc.gov/foodsafety/outbreaknetenhanced). States can receive funding for multiple programs. For analysis purposes, we assigned states to the program with the highest average funding award per capita (e.g., states with CoE and FoodCORE or OBNE were categorized as CoE). ELC-funded state programs for norovirus included Norovirus Sentinel Testing and Tracking (NoroSTAT, https://www.cdc.gov/norovirus/reporting/norostat). State programs for foodborne illness funded by CDC under the Emerging Infections Program included the Foodborne Diseases Active Surveillance Network (FoodNet; https://www.cdc.gov/foodnet). Environmental health outbreak response programs included FDA Voluntary National Retail Regulatory Food Program Standard 5, state-level meat and poultry inspection, FDA Rapid Response Team, Environmental Health Specialists Network, and the National Environmental Assessment Reporting System; the CIFOR Food Safety Programs Reference Guide contains program descriptions (7). We obtained surveillance data for state estimates of Salmonella and STEC O157 illnesses from the Laboratory-based Enteric Disease Surveillance (LEDS) system (8,9) and used them to compare underlying disease rates with outbreak reporting.
Outbreak Characteristics
We obtained outbreak characteristics from FDOSS. Characteristics included the number of ill cases per outbreak (laboratory-confirmed and probable primary cases); setting identified (yes/no); setting type (restaurant, private residence, institution, or other); food implicated (yes/no); food implicated using food categories defined by IFSAC (10); and whether the implicated food was confirmed or suspected. During 2017 and 2018, states reported foods as confirmed or suspected directly to NORS. For outbreaks before 2017, in this analysis we retrospectively classified implicated foods as confirmed or suspected using criteria outlined in the current NORS guidance (https://www.cdc.gov/nors/forms.html).
During 2009–2018, a total of 8,131 single-state outbreaks involving 131,525 outbreak-associated illnesses were reported. Of these, 5,986 (74%) had a confirmed or suspected etiology. Causes of the outbreaks included norovirus (2,798; 47%), Salmonella (1,191; 20%), bacterial toxins (617; 10%), and STEC O157 (150; 3%) (Table 1). The etiology was confirmed for 49% of the outbreaks (range across states 21%–84%). The percentage of outbreaks with a confirmed etiology was higher for Salmonella (92%) and STEC (93%) outbreaks than for norovirus (55%) and bacterial toxin (42%) outbreaks. A confirmed or suspected food vehicle was identified for 36% of the total outbreaks (range by state 11%–77%) (Table 1).
Figure 1
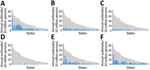
Figure 1. Mean annual rates of foodborne disease outbreaks reported to the Centers for Disease Control and Prevention per 10 million population by etiology and US state (deidentified), Foodborne Disease Outbreak Surveillance...
Figure 2
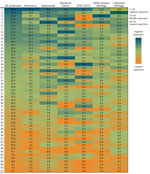
Figure 2. Annual rates of foodborne-illness outbreaks per 10 million population by reporting state and etiology, Foodborne Disease Outbreak Surveillance System, United States, 2009–2018. STEC, Shiga toxin–producing Escherichia coli.
Overall, states reported a mean of 29 outbreaks per 10 million population per year (range by state: 5–86 outbreaks) and a mean of 9 (range 0.5–52) norovirus outbreaks, 5 Salmonella (range 1–11) outbreaks, 3 (range 0.1–8) bacterial toxin outbreaks, and 0.9 (range 0.1–3) STEC O157 outbreaks per 10 million population per year (Table 1; Figure 1). The 10 states with the highest number of reported outbreaks (high reporters) averaged 62 outbreaks per 10 million population per year, whereas the 10 states with the fewest number of reported outbreaks (low reporters) averaged 9 and the remaining 30 states (middle reporters) 24 outbreaks per 10 million population per year (Figure 2). Outbreak reporting quintiles were mostly consistent across pathogens, with the exception of STEC O157 (Figure 2). Among outbreaks with a known etiology other than norovirus, Salmonella, bacterial toxins, and STEC O157, the most common etiologies were fish toxins (433 outbreaks, 33%) and Campylobacter (294 outbreaks, 22%).
Figure 3
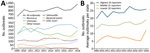
Figure 3. Foodborne outbreaks reported through the Foodborne Disease Outbreak Surveillance System, by etiology and reporting group, United States, 2009–2018. A) Single-state foodborne outbreaks by etiology. B) Average outbreaks per state by...
During 2009–2018, low reporters reported less than one third the number of outbreaks (624) reported by high reporters (2,416) (Table 2). This pattern was similar over time except in 2017–2018, when the number of outbreaks reported by low reporters more than doubled as a result of changes in reporting practices in a single large-population state (Figure 3, panels A, B). Low reporters were significantly less likely than middle and high reporters to report outbreaks with an identified etiology (57% low, 73% middle, 79% high) and reported fewer norovirus outbreaks (5% low, 60% middle, 36% high). Low reporters were also less likely to identify a setting (73% low, 92% middle, 96% high) and less likely to implicate (26% low, 38% middle, 36% high) or confirm (56% low, 75% middle, 75% high) a food vehicle. Low reporters were more likely to report the sex of case-patients as unknown (low 13%, 9% middle, 8% high). Low reporters were also more likely to report larger outbreaks (median for low, 10 cases; middle, 8 cases; high, 6 cases) (Table 2). These trends were similar across all pathogen groups.
We found no apparent associations between reporting structure and reporting group (Table 3). The percentage of state agency finance received from federal sources was similar across reporting groups, and although high reporters (27%) were more likely than middle reporters (21%) and low reporters (15%) to have received federal funding from CDC, the difference was not statistically significant. Per capita ELC funding was, however, significantly associated with reporting group; high reporters received more funding ($1.30 per capita) than middle reporters ($0.81) and low reporters ($0.44) (p<0.01). Receiving funding for foodborne programs was not statistically significantly associated with reporting group, but all reporters in the highest funding tiers (CoE, FoodCORE) were high or middle reporters, and only 1 of the 15 states receiving no foodborne program funding was a high reporter. Reporters receiving OBNE funding were equally distributed across reporting groups. Similarly, differences between reporters based on whether they receive funding for NoroSTAT or FoodNet were not statistically significant across tiers, but all states receiving funding were high or middle reporters. We saw no association between participation in environmental health outbreak response programs and reporting (Table 3). We observed similar trends for outbreak and structural characteristics across reporters for outbreaks caused by 4 pathogens (Appendix Tables 1–4). The average Salmonella incidence rate as reported to LEDS was consistent across reporting groups (Appendix Table 2), whereas high reporters of STEC O157 outbreaks also reported a higher average STEC incidence rate (4.9 illnesses per 100,000 population) compared with middle (2.4) and low (2.6) reporters (p = 0.04) (Appendix Table 4).
Figure 4
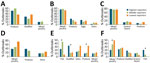
Figure 4. Most common foods implicated in foodborne illness, by detailed food category, Foodborne Disease Outbreak Surveillance System, United States, 2009–2018. Asterisks (*) indicate statistical significance (p<0.05 by Fisher exact test). Data...
The distribution of implicated foods categorized by Level 1 IFSAC overarching food category (i.e., land animals, aquatic animals, plant), multiple, or other differed substantially by reporting group for all etiologies and other known etiologies, but not for norovirus, Salmonella, bacterial toxin, and STEC O157 outbreaks (Table 4). We saw slightly more variation across reporters when implicated foods were classified by more detailed level 2 food type categories (e.g., fish, shellfish, dairy, meat and poultry, eggs, produce, grains and beans); the low reporters reporting fewer produce outbreaks for norovirus, Salmonella, and STEC O157 etiology outbreaks, and more meat and poultry outbreaks for STEC O157 and outbreaks of unknown etiology (Figure 4).
Several factors may affect outbreak reporting. NORS is a passive, voluntary system, and reporting depends on state and local capacity to detect, investigate, and report outbreaks. We found considerable variation across states in the number and types of foodborne outbreaks reported through NORS. The top 10 states reported 4 times more outbreaks per 10 million population than the lowest 10 states reported. The widest gap in outbreak reporting rates was for norovirus outbreaks; the highest reporter reported >40 times as many outbreaks as the lowest one. We also found variation in the types of outbreaks reported by states; low reporters were more likely to report larger outbreaks caused by reportable conditions (e.g., Salmonella, STEC O157) and less likely to implicate a setting or food vehicle in an outbreak.
Some differences in outbreak reporting may be due to differences in underlying incidence of disease. For example, most outbreaks associated with fish toxins are inherently regional, occurring in coastal states (11), and they tend to be smaller (12). In this study, aquatic animal outbreaks were mostly associated with norovirus and were more likely to occur in coastal states. We found that states that reported more STEC O157 outbreaks also reported a higher incidence of STEC to LEDS than middle and low reporters. However, although regional variation is substantial in reported Salmonella cases by population overall and among serotypes (13), we did not find Salmonella outbreak reporting to be correlated with incidence. Despite variation in outbreak reporting across states, we did not identify substantial differences over time or in the foods reported, which suggests that national outbreak surveillance is stable and a reliable source for monitoring relative trends in foodborne illness, including estimating food source attribution.
The structural characteristic most closely associated with outbreak reporting rates was per capita ELC funding. High reporters received ≈3 times as much funding as low reporters. These estimates included funding for nonfoodborne infectious disease program areas, such as healthcare-associated infections and vectorborne disease, suggesting that increasing funding has a positive effect overall on public health department capacity. In foodborne outbreak investigations, epidemiologists work directly on or collaborate with waterborne, animal contact, and other communicable disease programs, especially in local public health agencies. We observed that states that were high reporters were high reporters across multiple pathogen groups, including pathogens detected primarily through reportable disease surveillance (Salmonella, STEC O157) and pathogens detected primarily through nonreportable, or complaint-based, surveillance (norovirus, bacterial toxins).
The ability of states to detect outbreaks varies and depends on type of surveillance systems, interview questionnaires, cluster and outbreak tracking systems, case definitions, and laboratory testing capacity. Previous work found a correlation between the number of consumer complaints received by an agency and outbreak reporting rates; however, complaint systems range from no system, to localized systems that do not communicate across jurisdictions, to fully centralized systems (14). Jones et al. found that outbreak reporting was higher in states requiring submission of all Salmonella isolates to state laboratories and in states that routinely perform molecular subtyping of all isolates (15), which has since become standard practice.
Once an outbreak is detected, investigators determine whether they have the resources to proceed with an investigation. Most jurisdictions prioritize investigations associated with pathogens that may cause more severe illness (e.g., STEC O157); however, many lack the personnel to investigate outbreaks of less severe illness or may intentionally deprioritize norovirus outbreaks that are more likely to spread person-to-person, such as in congregate settings (16). Furthermore, outbreak investigations are costly (17,18), requiring time, resources, and commitment among competing priorities (19), and some jurisdictions may be less willing to divert personnel and resources from other public health activities or may prioritize outbreaks on the basis of the likelihood of finding actionable information. Cross-disciplinary and interagency collaboration is crucial to successful outbreak investigations; states reporting more outbreaks also reported more collaboration with other states and federal partners (15). Finally, states differentially interpret foodborne outbreak and cluster case definitions and report inconsistency and ambiguity in how these definitions are applied for national reporting (19).
Although overall ELC funding was associated with increased reporting, we did not find a statistically significant association between reporting and participation in CDC ELC-funded foodborne (CoE, FoodCORE, OBNE) and norovirus (NoroSTAT) programs, CDC foodborne programs funded through other mechanisms (FoodNet), or environmental health programs. This finding could be caused by a delay in observing effects of the funding award. Average funding awards vary within programs, and data on funding for specific foodborne programs were not readily accessible. For example, the average annual award for FoodCORE is $190,000–$510,000 per site, depending on population size and individual work plans (20). Funding is awarded through an application process, so awards may reflect capacity and support in the jurisdiction applying, whereas states with less capacity may be less likely to apply for or receive supplemental ELC grant funding. ELC funding awards are competitive and could be an indication of the underlying capacity of public health agencies to conduct surveillance, rather than a specific cause for high reporting of foodborne disease outbreaks.
Outbreak investigations provide critical information on the epidemiology of foodborne diseases and the foods that cause illness. Opportunities to improve outbreak response and reporting are ample, and improvements could further our understanding of what causes foodborne illnesses. Funding is not the only investment needed to improve capacity. Funding must be targeted and flexible (15). Peer, community, and cross-jurisdictional support, as fostered by the CoE within the 5 CoE regions (https://www.cdc.gov/foodsafety/centers), are potential mechanisms for improving capacity. Continuing education, workforce engagement, and ongoing evaluation and quality improvement using standardized metrics are all components of increasing public health capacity. Targeted CDC-led funding programs; expansion of CoE-led regional training, mentorship, and technical assistance programs; and opportunities for state- and local-level collaboration via peer networks appear to be useful for improving outbreak surveillance and response. Evaluation using standardized metrics (7,20) can identify evidence-based practices to continue to make the system more efficient and effective.
Despite variability in reporting, this study found the food categories reported across groups were similar, which supports the use of outbreak data in food source attribution estimates. IFSAC, a collaboration across 3 federal agencies (CDC, FDA, and USDA-FSIS), produces annual estimates of the most common food categories responsible for illnesses caused by pathogens based on national surveillance data for foodborne outbreaks (2). However, the extent to which the distribution of food vehicles and locations of preparation implicated in outbreaks reflect the same vehicles and locations as sporadic foodborne illnesses is unknown (10). Most foodborne illnesses are not associated with a known outbreak, and the use of outbreak data for attribution may be limited if reported outbreaks are not representative of all foodborne outbreaks (3). Our study found that although there is variation in the number and types of outbreaks reported by states as well as an overall low proportion of outbreaks with an implicated food, there was not substantial variation in the foods reported, suggesting the IFSAC approach of using outbreak data for national food source attribution estimates is not biased by state reporting practices. This finding is consistent with other work that found similar characteristics of sporadic and outbreak-associated foodborne illnesses and continues to be an active focus for IFSAC (21).
The first limitation of our study is that no data are readily available to identify and describe outbreaks that were detected and investigated but not reported. Some jurisdictions may be more likely to report outbreaks with an identified etiologic agent or food vehicle. Furthermore, in focusing on reporting, this study did not capture other improvements in completeness and timeliness of outbreak response activities. For example, FoodCORE metrics demonstrate improved completeness and timeliness of outbreak investigations (20), and this study did not assess the effects of intermediary metrics on national reporting. Limited data were available on state structural characteristics, and our study did not incorporate factors such as laboratory testing metrics, surveillance and investigation practices, and other state or local level established practices. Relevant survey data sources have not been updated in the past decade, including surveys used by Jones, et al., such as the Council of State and Territorial Epidemiologists Food Safety Capacity Assessment and the Association of Public Health Laboratories national PulseNet survey (22,23), which limited our ability to compare the effects of structural factors over time. Finally, participation in specific foodborne surveillance programs, which we did not find to be significantly associated with reporting, changed over the course of the study period, and our methods did not adjust for changes in participation over time. Specifically, the CoE program was started in 2012, and OBNE was started in 2015.
Future projects should include national surveys that further explore the association between structural factors and detecting, investigating, and reporting foodborne outbreaks. Some data were from different years; for example, ELC funding was only publicly available for 2016–2018. This analysis focused only on reported outbreaks with foodborne transmission, and states likely have different practices for reporting different transmission routes. Finally, this study focused on state-level outbreak reporting. However, most outbreak investigations occur at local public health agencies. Expertise, interest, and preparedness vary dramatically within states, particularly decentralized ones, to respond to foodborne outbreaks. Results from this study did not indicate a relationship between state legal structure and reporting, but this variable does not capture the nuance and diversity of the responsibility of investigating foodborne outbreaks. However, this finding could affect how federal funders such as CDC can target funding to improve communicable disease surveillance and public health preparedness.
In conclusion, this study demonstrates that investments in public health programming produce large benefits and measurable impact on national surveillance. Other studies have shown that robust surveillance systems improve health and decrease overall healthcare costs (24). Because individual state characteristics do not appear to bias our detection of which foods are associated with outbreaks, improving outbreak surveillance will also improve food attribution efforts.
Ms. White is a senior research instructor in the department of epidemiology at the Colorado School of Public Health. Her primary research interests are public health surveillance and the epidemiology of foodborne diseases.
Acknowledgments
We thank members of the Interagency Food Safety Analytics Collaboration for their critical reading of the manuscript and helpful comments.
This work was funded in part by the Colorado and Minnesota Integrated Food Safety Centers of Excellence, which are supported by the Epidemiology and Laboratory Capacity for Infectious Disease Cooperative Agreement through the Centers for Disease Control and Prevention.
References
- Scallan E, Hoekstra RM, Angulo FJ, Tauxe RV, Widdowson MA, Roy SL, et al. Foodborne illness acquired in the United States—major pathogens. Emerg Infect Dis. 2011;17:7–15. DOIPubMedGoogle Scholar
- Interagency Food Safety Analytics Collaboration. Foodborne illness source attribution estimates for Salmonella, Escherichia coli O157, Listeria monocytogenes, and Campylobacter using multi-year outbreak surveillance data, United States. Atlanta and Washington: US Department of Health and Human Services; 2020.
- Painter JA, Hoekstra RM, Ayers T, Tauxe RV, Braden CR, Angulo FJ, et al. Attribution of foodborne illnesses, hospitalizations, and deaths to food commodities by using outbreak data, United States, 1998-2008. Emerg Infect Dis. 2013;19:407–15. DOIPubMedGoogle Scholar
- Katz R. State foodborne illness reporting laws, 2011–2013. Inter-university Consortium for Political and Social Research. 2014 [cited 2022 Apr 15]. https://www.icpsr.umich.edu/web/HMCA/studies/34935
- Keene BK, Kanwat CP. Enteric disease outbreak investigation and surveillance survey. Presented at: Council for State and Territorial Epidemiologists 2007 Annual Conference; June 24–28, 2007; Atlantic City, NJ, USA.
- Centers for Disease Control and Prevention. Epidemiology and Laboratory Capacity for Prevention and Control of Emerging Infectious Diseases (ELC). 2021 [cited 2021 May 19]. https://www.cdc.gov/ncezid/dpei/epidemiology-laboratory-capacity.html
- Hedberg C. Guidelines for foodborne disease outbreak response. 3rd edition. Atlanta: Council to Improve Foodborne Outbreak Response; 2020 [cited 2021 May 19]. https://cifor.us/downloads/clearinghouse/CIFOR-Guidelines-Complete-third-Ed.-FINAL.pdf
- Centers for Disease Control and Prevention. National Salmonella surveillance annual report, 2016. Atlanta: US Department of Health and Human Services; 2018.
- Centers for Disease Control and Prevention. National Shiga toxin–producing Escherichia coli (STEC) surveillance annual report, 2016. Atlanta: US Department of Health and Human Services; 2018.
- Richardson LC, Bazaco MC, Parker CC, Dewey-Mattia D, Golden N, Jones K, et al. An updated scheme for categorizing foods implicated in foodborne disease outbreaks: a tri-agency collaboration. Foodborne Pathog Dis. 2017;14:701–10. DOIPubMedGoogle Scholar
- Barrett KA, Nakao JH, Taylor EV, Eggers C, Gould LH. Fish-associated foodborne disease outbreaks: United States, 1998–2015. Foodborne Pathog Dis. 2017;14:537–43. DOIPubMedGoogle Scholar
- Dewey-Mattia D, Manikonda K, Hall AJ, Wise ME, Crowe SJ. Surveillance for foodborne disease outbreaks—United States, 2009–2015. MMWR Surveill Summ. 2018;67:1–11. DOIPubMedGoogle Scholar
- Centers for Disease Control and Prevention. An atlas of Salmonella in the United States, 1968–2011: laboratory-based enteric disease surveillance. Atlanta: US Department of Health and Human Services; 2013.
- Li J, Shah GH, Hedberg C. Complaint-based surveillance for foodborne illness in the United States: a survey of local health departments. J Food Prot. 2011;74:432–7. DOIPubMedGoogle Scholar
- Jones TF, Rosenberg L, Kubota K, Ingram LA. Variability among states in investigating foodborne disease outbreaks. Foodborne Pathog Dis. 2013;10:69–73. DOIPubMedGoogle Scholar
- Marsh Z, Shah MP, Wikswo ME, Barclay L, Kisselburgh H, Kambhampati A, et al. Epidemiology of foodborne norovirus outbreaks—United States, 2009–2015. Food Saf (Tokyo). 2018;6:58–66. DOIPubMedGoogle Scholar
- Ailes E, Budge P, Shankar M, Collier S, Brinton W, Cronquist A, et al. Economic and health impacts associated with a Salmonella Typhimurium drinking water outbreak-Alamosa, CO, 2008. PLoS One. 2013;8:
e57439 . DOIPubMedGoogle Scholar - Thomas MK, Vriezen R, Farber JM, Currie A, Schlech W, Fazil A. Economic cost of a Listeria monocytogenes outbreak in Canada, 2008. Foodborne Pathog Dis. 2015;12:966–71. DOIPubMedGoogle Scholar
- Murphree R, Garman K, Phan Q, Everstine K, Gould LH, Jones TF. Characteristics of foodborne disease outbreak investigations conducted by Foodborne Diseases Active Surveillance Network (FoodNet) sites, 2003-2008. Clin Infect Dis. 2012;54(Suppl 5):S498–503. DOIPubMedGoogle Scholar
- Biggerstaff GK. FoodCORE Team. Improving response to foodborne disease outbreaks in the United States. J Public Health Manag Pract. 2015;21:E18–26. DOIPubMedGoogle Scholar
- Ebel ED, Williams MS, Cole D, Travis CC, Klontz KC, Golden NJ, et al. Comparing characteristics of sporadic and outbreak-associated foodborne illnesses, United States, 2004–2011. Emerg Infect Dis. 2016;22:1193–200. DOIPubMedGoogle Scholar
- Boulton ML, Rosenberg LD; Centers for Disease Control and Prevention (CDC). Food safety epidemiology capacity in state health departments—United States, 2010. MMWR Morb Mortal Wkly Rep. 2011;60:1701–4.PubMedGoogle Scholar
- Association of Public Health Laboratories. PulseNet on the frontlines of foodborne disease surveillance: national molecular subtyping network for foodborne pathogens. APHL Public Health Laboratory Issues in Brief. April 2013 [cited 2022 Apr 17]. https://www.aphl.org/aboutAPHL/publications/Documents/FS_2013April29_PulseNet-on-the-Front-Lines-of-Foodborne-Disease-Surveillance.pdf
- Scharff RL, Besser J, Sharp DJ, Jones TF, Peter GS, Hedberg CW. An economic evaluation of PulseNet: a network for foodborne disease surveillance. Am J Prev Med. 2016;50(Suppl 1):S66–73. DOIPubMedGoogle Scholar
Figures
Tables
Cite This ArticleOriginal Publication Date: May 11, 2022
Table of Contents – Volume 28, Number 6—June 2022
| EID Search Options |
|---|
|
|
|
|
|
|
Please use the form below to submit correspondence to the authors or contact them at the following address:
Alice White, Department of Epidemiology, Colorado School of Public Health, 13001 East 17th Pl, Mailstop B119, Aurora, CO 80045, USA
Top