Volume 28, Number 7—July 2022
Research
Nipah Virus Detection at Bat Roosts after Spillover Events, Bangladesh, 2012–2019
Clifton D. McKee1 , Ausraful Islam1, Mohammed Ziaur Rahman, Salah Uddin Khan, Mahmudur Rahman, Syed M. Satter, Ariful Islam, Claude Kwe Yinda, Jonathan H. Epstein, Peter Daszak, Vincent J. Munster, Peter J. Hudson, Raina K. Plowright, Stephen P. Luby, and Emily S. Gurley
Figure 2
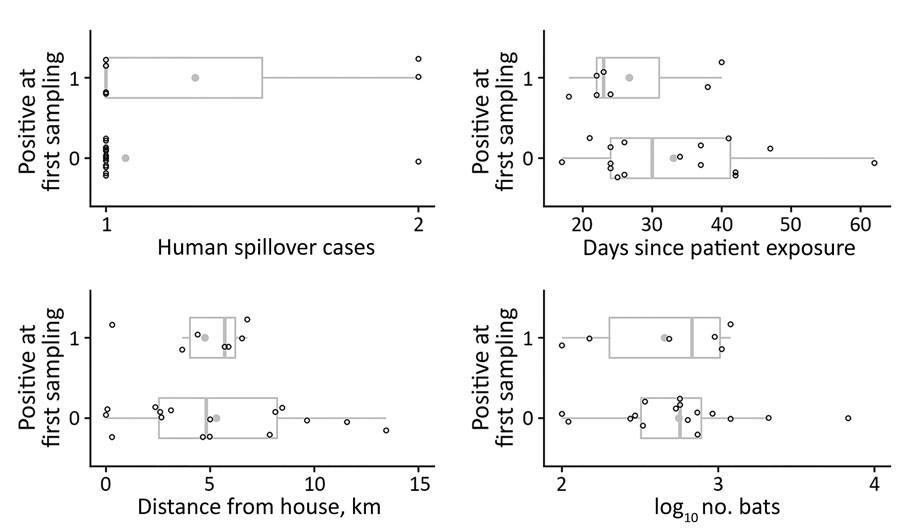
Figure 2. Descriptive variables for 23 Pteropus medius bat roosts sampled near confirmed human Nipah virus cases, Bangladesh, 2012–2019. Open circles show the values associated with the first human case associated with each roost; gray circles indicate means for each variable and positivity status (0 or 1). Vertical lines within boxes indicate medians; box left and right edges indicate the 25th and 75th percentiles; error bars indicate +1.5 times the interquartile range.
1These first authors contributed equally to this article.
Page created: April 27, 2022
Page updated: June 18, 2022
Page reviewed: June 18, 2022
The conclusions, findings, and opinions expressed by authors contributing to this journal do not necessarily reflect the official position of the U.S. Department of Health and Human Services, the Public Health Service, the Centers for Disease Control and Prevention, or the authors' affiliated institutions. Use of trade names is for identification only and does not imply endorsement by any of the groups named above.