Volume 28, Number 7—July 2022
Research
Analyzing and Modeling the Spread of SARS-CoV-2 Omicron Lineages BA.1 and BA.2, France, September 2021–February 2022
Figure 2
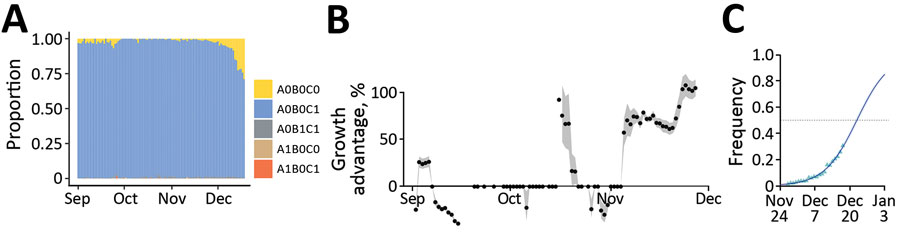
Figure 2. Monitoring and quantifying variant spread in using SARS-CoV-2 variant-specific screening tests (N = 103,757), France, October 1–December 18, 2021. A) Raw proportion of the test outcomes. B) Growth advantage of A0B0C0 tests over A0B0C1 in France. Points indicate the median growth advantage estimated on a 21-day sliding window; the gray shading indicates 95% CI. C) Estimated frequency and growth advantage of A0B0C0 relative to the sum of A0B0C0 and A0B0C1 tests in France, corresponding to the last point of panel A. Triangles show the fitted values from the model, the line the model output, and the gray shading the 95% CI. Raw occurrence data from panel A is stratified by region in Appendix 1 Figure 1. Test designations indicate the absence of a mutation by a 0 and its presence by 1; the mutations are S:484K (A), S:E484Q (B), and S:452R (C); A0B0C1 mostly corresponds to Delta variant, A0B0C0 to Alpha or Omicron variant or an ancestral lineage, A0B1C1 to Kappa or Kappa-like variants, A1B0C0 to Beta or the Gamma variant, and A1B0C1 to a Delta variant with an E484K mutation.