Volume 28, Number 7—July 2022
Research
Analyzing and Modeling the Spread of SARS-CoV-2 Omicron Lineages BA.1 and BA.2, France, September 2021–February 2022
Mircea T. Sofonea, Bénédicte Roquebert, Vincent Foulongne, David Morquin, Laura Verdurme, Sabine Trombert-Paolantoni, Mathilde Roussel, Jean-Christophe Bonetti, Judith Zerah, Stéphanie Haim-Boukobza, and Samuel Alizon
Figure 6
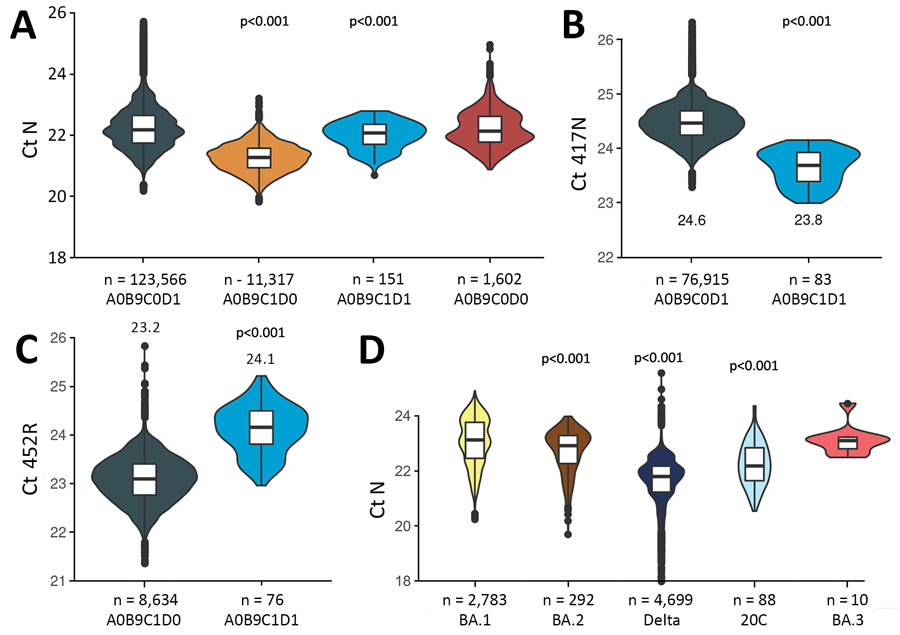
Figure 6. Ct values from the SARS-CoV-2 variant-specific screening quantitative PCR tests (N = 136,636), France, December 6, 2021–February 28, 2022. Ct values refer to the control (nucleoprotein) gene (A and D), 417N mutation (B), and 452R mutation (C). Values are shown as a function of the test outcome (A, B, and C) or the virus lineage (D). P values derived from a t-test where the reference variable is either A0B9C0D1 or BA.1. Boxes within violin plots show the median (horizontal line within box), 50% (box tops and bottoms), and 95% CIs (error bars). Tests were the same as in Figure 3, but only screening tests with Ct <28 were included to ensure robust screening results. Ct, cycle threshold; N, nucleoprotein gene.
Page created: May 03, 2022
Page updated: June 18, 2022
Page reviewed: June 18, 2022
The conclusions, findings, and opinions expressed by authors contributing to this journal do not necessarily reflect the official position of the U.S. Department of Health and Human Services, the Public Health Service, the Centers for Disease Control and Prevention, or the authors' affiliated institutions. Use of trade names is for identification only and does not imply endorsement by any of the groups named above.