Volume 28, Number 9—September 2022
Research
Detection of Endosymbiont Candidatus Midichloria mitochondrii and Tickborne Pathogens in Humans Exposed to Tick Bites, Italy
Figure 2
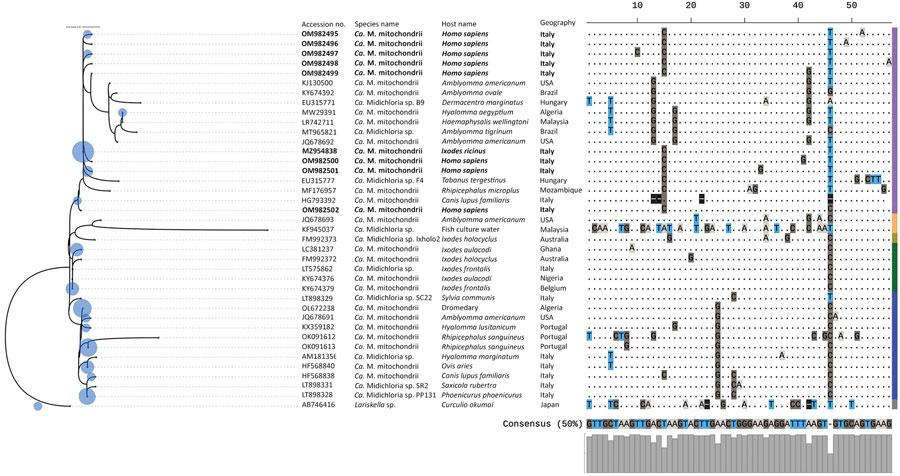
Figure 2. Maximum-likelihood phylogenic tree of endosymbiont Candidatus Midichloria mitochondrii clades detected with tickborne pathogens in humans exposed to tick bites, Italy, 2021. The tree corresponds to the IQ-TREE (http://www.iqtree.org) inferred from 38 partial (202 bp) DNA sequences with 28.7% of informative sites by using the Kimura 3-parameter model with empirical frequencies plus regression (TPM3+F+R2) model under 1,000 bootstrap replicates and maximum-likelihood method. Accession numbers and species name are indicated at the tip of each branch. Bold blue text indicates sequences amplified in the study area. The tree includes 123 query sequences representing all 16S rRNA entries from GenBank (blue circles on left) placed at the branch and leaf nodes by using the APPLES algorithm (https://github.com/balabanmetin/apples). The ClustalX (http://www.clustal.org/clustal2) sequence alignment viewer of the informative sites from the 16S rRNA alignment and their 50% consensus are shown. Colored column at far right denotes taxonomic annotation; purple indicates clade A, blue indicates clade B, green indicates clade C, yellow indicates clade D, green indicates clade E, gray indicates outgroup. Ca., Candidatus.
1These authors contributed equally to this article.