Volume 29, Number 10—October 2023
CME ACTIVITY - Synopsis
Serotype Distribution and Disease Severity in Adults Hospitalized with Streptococcus pneumoniae Infection, Bristol and Bath, UK, 2006‒2022
Figure 1
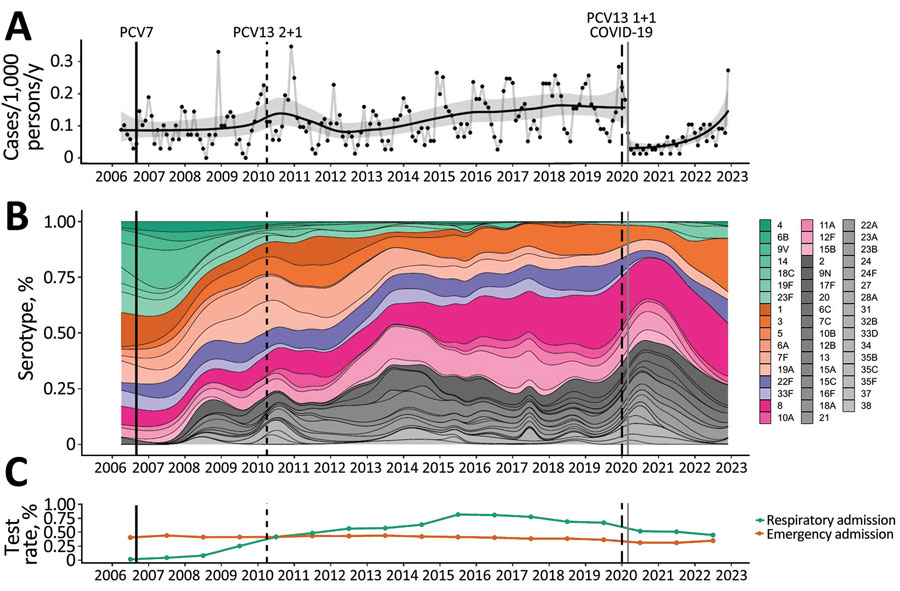
Figure 1. Distribution of pneumococcal serotypes in hospitalized patients, Bristol and Bath, UK, 2006–2022. A) Incidence of blood culture‒positive pneumococcal disease. Data shown include only invasive disease; for comparison with noninvasive disease, see the Appendix. Black dots indicate monthly observations, black line indicates a binomial time series model, and gray shading indicate 95% CIs. Population estimates are provided in the Appendix. B) Multinomial percentage of pneumococcal serotypes in the invasive pneumococcal disease population with known serotype. Green bars indicate 7-valent PCV (PCV7) serotypes; orange, PCV13–7 (PCV13 minus PCV7 serotypes); purple, PCV15–13; pink, PCV20–15; gray, serotypes not contained in PCV vaccines. Individual serotypes are shown in the legend on the panel. C) Testing rates for blood cultures with respect to acute admissions and BinaxNOW (https://www.abbott.com) tests with respect to acute respiratory admissions. Estimates are presented at the midyear time point, relative to the data they represent. For all panels, vertical lines indicate introduction of PCV7 (solid black), PCV13 (2 + 1 schedule) (thin black dashed line), PCV13 (1 + 1 schedule) (thick black dashed line) into the UK childhood vaccination program and the beginning of large hospital admissions in Bristol caused by SARS-CoV-2 (solid gray). PCV, pneumococcal conjugate vaccine.
1These authors contributed equally to this article.