Skip directly to site content Skip directly to page options Skip directly to A-Z link Skip directly to A-Z link Skip directly to A-Z link
Volume 29, Number 11—November 2023
Research

Environmental Persistence and Disinfection of Lassa Virus

Marlee Shaffer1, Robert J. Fischer1, Shane Gallogly, Olivia Ginn, Vincent Munster, and Kyle BibbyComments to Author 
Author affiliations: University of Notre Dame, Notre Dame, Indiana, USA (M. Shaffer, O. Ginn, K. Bibby); National Institutes of Health, Hamilton, Montana, USA (R.J. Fischer, S. Gallogly, V. Munster)

Main Article

Figure 2

First-order decay of Josiah and Sauerwald strains in water in a study of environmental persistence and disinfection of Lassa virus. A) Josiah strain in deionized water; B) Josiah strain in wastewater; C) Sauerwald strain in deionized water; D) Sauerwald strain in wastewater. Each plotted point represents the mean of 3 independent experimental replicates run concurrently, and the error bars show the standard deviation. Solid blue and orange lines indicate decay rates; dashed lines indicate the assay’s detection limits; hollow circles represent points below the detection limit that were not included in the regression analysis. The equation of the linear regression (y) and the R2 value are shown on the plots. All plotting, regressions, and statistical analyses were performed using R Studio 2022.07.2 (The R Foundation for Statistical Computing, https://www.r-project.org). C, initial concentration of infectious virus; Ct, concentration of infectious virus at time, t; TCID50, 50% tissue culture infectious dose.

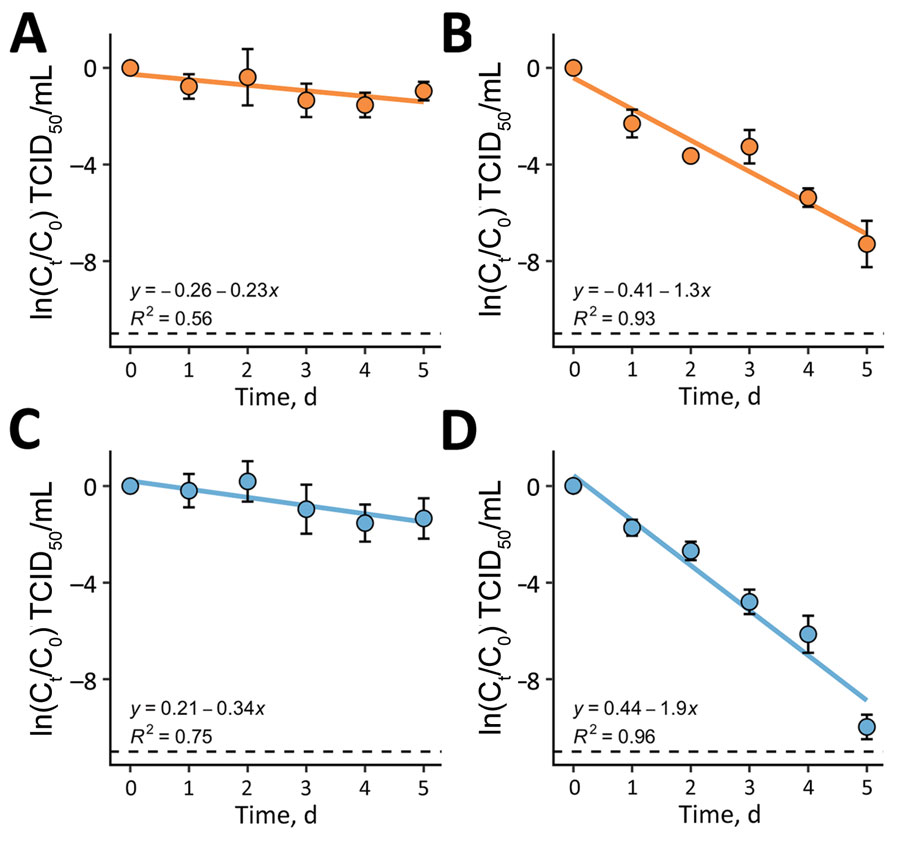
Figure 2. First-order decay of Josiah and Sauerwald strains in water in a study of environmental persistence and disinfection of Lassa virus. A) Josiah strain in deionized water; B) Josiah strain in wastewater; C) Sauerwald strain in deionized water; D) Sauerwald strain in wastewater. Each plotted point represents the mean of 3 independent experimental replicates run concurrently, and the error bars show the standard deviation. Solid blue and orange lines indicate decay rates; dashed lines indicate the assay’s detection limits; hollow circles represent points below the detection limit that were not included in the regression analysis. The equation of the linear regression (y) and the R2 value are shown on the plots. All plotting, regressions, and statistical analyses were performed using R Studio 2022.07.2 (The R Foundation for Statistical Computing, https://www.r-project.org). C, initial concentration of infectious virus; Ct, concentration of infectious virus at time, t; TCID50, 50% tissue culture infectious dose.

Main Article

1These first authors contributed equally to this article.

Page created: September 26, 2023
Page updated: October 23, 2023
Page reviewed: October 23, 2023
The conclusions, findings, and opinions expressed by authors contributing to this journal do not necessarily reflect the official position of the U.S. Department of Health and Human Services, the Public Health Service, the Centers for Disease Control and Prevention, or the authors' affiliated institutions. Use of trade names is for identification only and does not imply endorsement by any of the groups named above.
file_external