Volume 29, Number 11—November 2023
Research
Neurologic Effects of SARS-CoV-2 Transmitted among Dogs
Figure 5
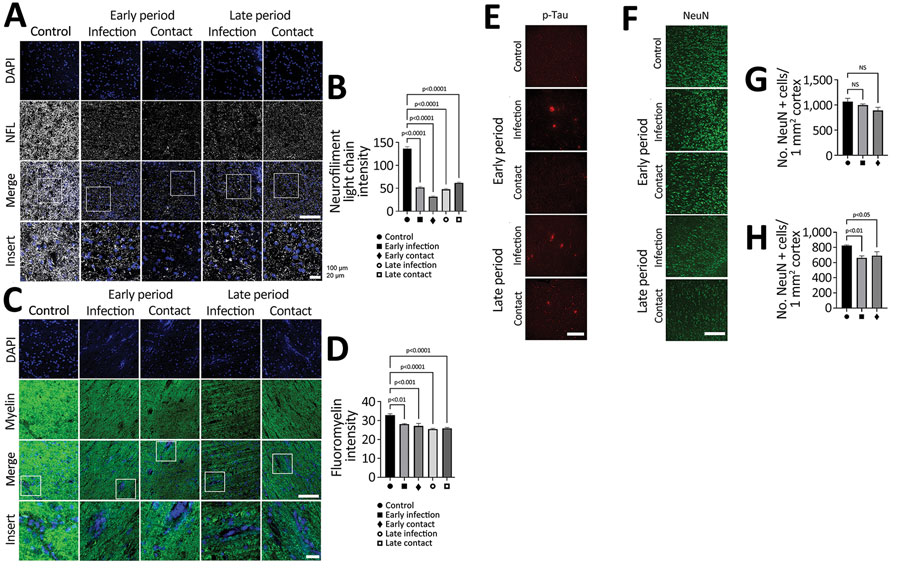
Figure 5. SARS-CoV-2 infection causing perivascular demyelination in the brain in dogs in study of the neurologic effects of SARS-CoV-2 transmitted among dogs. A, B) Representative fluorescent images and statistical analysis results of NFL (a marker of neurofilament light chain; gray) staining of canine brain white matter sections derived from SARS-CoV-2 infected and contact dogs at early and late dpi. Scale bar indicates 200 μm. Overall images from infected dogs demonstrate irregular axonal morphology compared with that of control dogs. Single-layer slice images. Scale bar indicates 20 μm. C, D) Representative fluorescent images and statistical analysis results of myelin (fluomyelin; green) and DAPI (blue) staining of canine brain white matter sections derived from SARS-CoV-2–infected and contact dogs at early and late dpi. Scale bar indicates 200 μm. E) Representative fluorescent images of p-tau (red) staining of canine brain gray matter sections derived from SARS-CoV-2–infected and contact dogs at early and late dpi. Scale bar indicates 200 μm. F–H) Representative fluorescent images (F) and statistical analysis results (G, H) of NeuN (a marker of neuron; green) staining of canine brain gray matter sections derived from SARS-CoV-2–infected and contact dogs at early (G) and late (H) infection. Scale bar indicates 200 μm. Statistical significance was determined using a 1-way analysis of variance. Data are presented as mean ±SEM. NS, not significant.
1These authors contributed equally to this article.