Skip directly to site content Skip directly to page options Skip directly to A-Z link Skip directly to A-Z link Skip directly to A-Z link
Volume 29, Number 4—April 2023
Dispatch

Serial Interval and Incubation Period Estimates of Monkeypox Virus Infection in 12 Jurisdictions, United States, May–August 2022

Zachary J. Madewell1Comments to Author , Kelly Charniga1, Nina B. Masters, Jason Asher, Lily Fahrenwald, William Still, Judy Chen, Naama Kipperman, David Bui, Meghan Shea, Katharine Saunders, Lori Saathoff-Huber, Shannon Johnson, Khalil Harbi, Abby L. Berns, Taidy Perez, Emily Gateley, Ian H. Spicknall, Yoshinori Nakazawa, Thomas L. Gift, and 2022 Mpox Outbreak Response Team2
Author affiliations: Centers for Disease Control and Prevention, Atlanta, Georgia, USA (Z.J. Madewell, K. Charniga, N.B. Masters, J. Asher, I.H. Spicknall, Y. Nakazawa, T.L. Gift); Chicago Department of Public Health, Chicago, Illinois, USA (L. Fahrenwald); District of Columbia Department of Health, Washington, DC, USA (W. Still); New York City Department of Health and Mental Hygiene, New York, New York, USA (J. Chen, N. Kipperman); California Department of Public Health, Sacramento, California, USA (D. Bui); Colorado Department of Public Health and Environment, Denver, Colorado, USA (M. Shea); Florida Department of Health, Tallahassee, Florida, USA (K. Saunders); Illinois Department of Public Health, Springfield, Illinois, USA (L. Saathoff-Huber); Michigan Department of Health and Human Services, Lansing, Michigan, USA (S. Johnson); North Carolina Department of Health and Human Services, Raleigh, North Carolina, USA (K. Harbi); Rhode Island Department of Health, Providence, Rhode Island, USA (A.L. Berns); South Carolina Department of Health and Environmental Control, Columbia, South Carolina, USA (T. Perez); Tennessee Department of Health, Nashville, Tennessee (E. Gateley)

Main Article

Figure 1

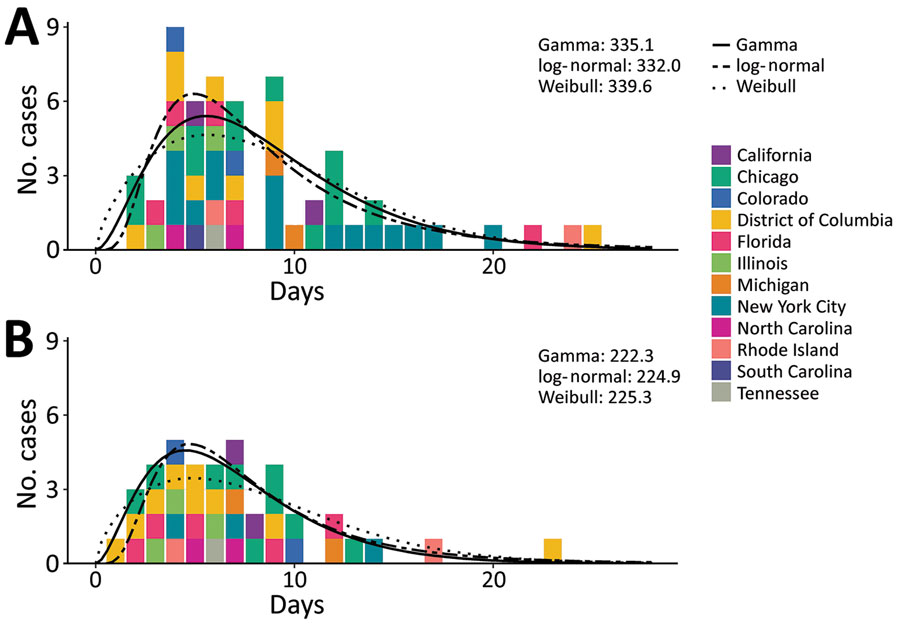
Empirical and fitted distributions of the serial intervals of rash onset (A) (n = 40 cases) and symptom onset (B) (n = 57 cases) for monkeypox virus, 12 jurisdictions, United States, May–August 2022. Leave-one-out information criterion values for each model are shown inside the plots in the upper right-hand corner.

Figure 1. Empirical and fitted distributions of the serial intervals of rash onset (A) (n = 40 cases) and symptom onset (B) (n = 57 cases) for monkeypox virus, 12 jurisdictions, United States, May–August 2022. Leave-one-out information criterion values for each model are shown inside the plots in the upper right-hand corner.

Main Article

1These first authors contributed equally to this article.

2Additional members of 2022 Mpox Outbreak Response Team who contributed data are listed at the end of this article.

Page created: January 23, 2023
Page updated: March 21, 2023
Page reviewed: March 21, 2023
The conclusions, findings, and opinions expressed by authors contributing to this journal do not necessarily reflect the official position of the U.S. Department of Health and Human Services, the Public Health Service, the Centers for Disease Control and Prevention, or the authors' affiliated institutions. Use of trade names is for identification only and does not imply endorsement by any of the groups named above.
file_external