Volume 29, Number 6—June 2023
Research
Similar Prevalence of Plasmodium falciparum and Non–P. falciparum Malaria Infections among Schoolchildren, Tanzania1
Figure 2
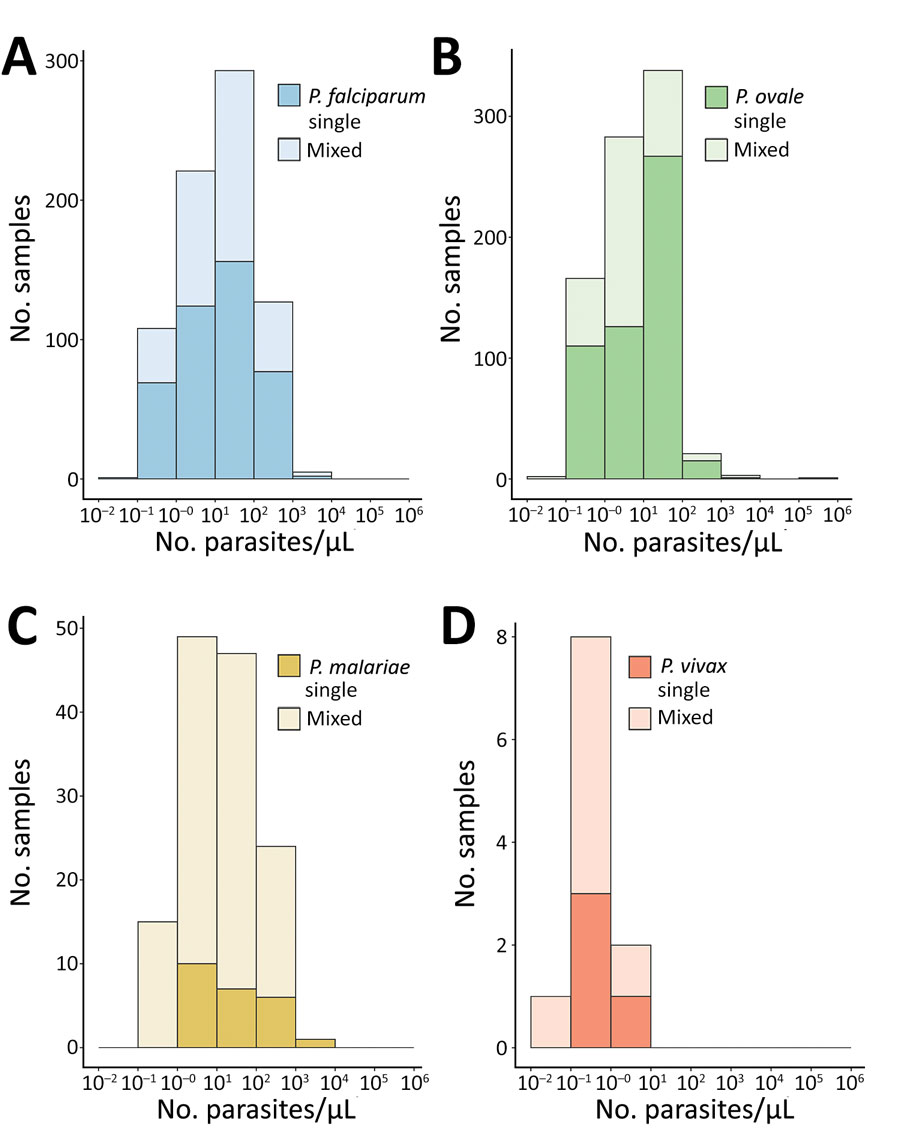
Figure 2. Estimated parasite density distributions according to malaria species in study of similar prevalence of Plasmodium falciparum and non–P. falciparum malaria infections among schoolchildren, Tanzania. We estimated Plasmodium spp. parasite densities for single infections and co-infections (mixed) by using semiquantitative PCR and species-specific primers (Appendix Table 1). Mixed infections included P. falciparum and nonfalciparum co-infections. Number of samples varied by species. P. ovale and P. vivax parasite densities were detected by using 45 PCR cycles; other species were determined by using 40 PCR cycles. A) P. falciparum: median (IQR) density was 11.4 (2.5–54.7) parasites/µL for single-species infections (n = 429) and 16.5 (3.5–56.9) parasites/µL for mixed-species infections (n = 326) (p = 0.117). B) P. ovale: median (IQR) density was 13.5 (1.3–30.1) parasites/µL for single-species infections (n = 519) and 3.1 (1.2–11.4) parasites/µL for mixed-species infections (n = 295) (p<0.001). C) P. malariae: median (IQR) density was 16.1 (3.8–164.0) parasites/µL for single-species infections (n = 24) and 11.2 (2.6–53.9) parasites/µL for mixed-species infections ([n = 112) (p = 0.169). D) P. vivax: median (IQR) density was 0.4 (0.2–0.9) parasites/µL for single-species infections (n = 4) and 0.7 (0.5–0.8) parasites/µL for mixed-species infections (n = 7) (p = 0.571). IQR, interquartile range.
1Data from this study were presented as a virtual poster at the American Society of Tropical Medicine and Hygiene conference, November 17–21, 2021.
2These first authors contributed equally to this article.
3These senior authors contributed equally to this article.