Volume 29, Number 6—June 2023
Research
Similar Prevalence of Plasmodium falciparum and Non–P. falciparum Malaria Infections among Schoolchildren, Tanzania1
Cite This Article
Citation for Media
Abstract
Achieving malaria elimination requires considering both Plasmodium falciparum and non–P. falciparum infections. We determined prevalence and geographic distribution of 4 Plasmodium spp. by performing PCR on dried blood spots collected within 8 regions of Tanzania during 2017. Among 3,456 schoolchildren, 22% had P. falciparum, 24% had P. ovale spp., 4% had P. malariae, and 0.3% had P. vivax infections. Most (91%) schoolchildren with P. ovale infections had low parasite densities; 64% of P. ovale infections were single-species infections, and 35% of those were detected in low malaria endemic regions. P. malariae infections were predominantly (73%) co-infections with P. falciparum. P. vivax was detected mostly in northern and eastern regions. Co-infections with >1 non–P. falciparum species occurred in 43% of P. falciparum infections. A high prevalence of P. ovale infections exists among schoolchildren in Tanzania, underscoring the need for detection and treatment strategies that target non–P. falciparum species.
Sub-Saharan Africa harbors 95% of the global malaria burden (1). National surveys conducted by ministries of health throughout Africa regularly assess Plasmodium falciparum prevalence (2); however, little is known about the prevalence and geographic distribution of non–P. falciparum (hereafter nonfalciparum) malaria species, such as P. malariae, P. vivax, and P. ovale curtisi or P. ovale wallikeri (hereafter P. ovale) (3–8). Although the clinical prevalence of nonfalciparum malaria in sub-Saharan Africa is dwarfed by P. falciparum (9), nonfalciparum species can still cause disease. P. malariae has been associated with increased risk for anemia (10) and other complications, such as chronic nephrotic syndrome (11,12). P. vivax can cause severe anemia, pregnancy-related complications, and death after recurrent infections, but infections in sub-Saharan Africa are infrequent (13–15). Clinical consequences of P. ovale infections have been mostly described in travelers and have been associated with severe infection in case reports (16).
Declining P. falciparum prevalence in East Africa might be associated with increasing nonfalciparum infections (17–20). However, comprehensive surveys of nonfalciparum malaria in sub-Saharan Africa have been infrequent because detection of those species remains challenging (11,17). Field diagnostic methods, such as microscopy and pan–Plasmodium spp. lactate dehydrogenase (LDH) or histidine-rich protein 2 (HRP2)–based rapid diagnostic tests (RDTs), lack sensitivity to detect nonfalciparum species (11,17). Nonfalciparum malaria parasite densities are often low, and most infected persons might not seek care. Mixed infections with P. falciparum can also complicate detection of nonfalciparum species (3,17). Molecular detection methods can sensitively detect nonfalciparum malaria species, but those methods remain largely confined to research use.
In Tanzania, the prevalence of malaria is high, accounting for 4.1% of global malaria deaths in 2020 (1). Although ≈93% of the population in mainland Tanzania is at risk for malaria, transmission throughout the country is highly heterogeneous (21). Transmission patterns are largely driven by geographic features of the country. Malaria transmission is low, unstable, and seasonal across the arid highlands and in urban centers; moderate and seasonally variable in southern, northern, and northwestern areas; and high and perennial along the coastal, lake, and southern lowland regions (21,22). Decades of concentrated malaria control interventions helped lower the national prevalence from 18% in 2008 to 7% in 2017 (23). Most reported malaria cases in Tanzania have been attributed to P. falciparum (9,21), but recent studies have also identified P. malariae, P. vivax, and P. ovale transmission (4,18,24,25). Given the widespread use of P. falciparum–specific HRP2-based RDTs for malaria diagnosis, the propensity for missed detection or misclassification of nonfalciparum species in Tanzania is high, and large-scale, geographically representative studies to assess spatial distributions of nonfalciparum malaria species are lacking. We used molecular methods to analyze blood samples collected during a national survey of schoolchildren in Tanzania and comprehensively characterize nonfalciparum malaria epidemiology.
Study Design
The 2017 School Malaria Parasitological Survey (SMPS) was a cross-sectional study of children who were 5–16 years of age and enrolled in public primary schools in mainland Tanzania. Methods for site selection and survey design mirrored the 2015 SMPS and have been previously described (22). Study regions were selected through a multistage sampling scheme to maintain geographic representation and reflect the heterogeneity of malaria transmission across Tanzania (22,26). The number of schools randomly selected per region was proportional to each region’s respective population (22,26). Within each school, an average of 100 students were randomly selected for screening. After consent, each student was interviewed to obtain demographic and clinical characteristics, a malaria RDT was performed, and a dried blood spot (DBS) sample was collected (22,26). The survey largely coincided with each region’s rainy season. From among students who provided a DBS, we selected a stratified random subpopulation for nonfalciparum malaria testing. To maintain representativeness, we selected students in proportions that equaled regional proportions reflected within the broader survey population.
Informed consent had been obtained from students and their legal guardians before survey data or blood sample collection, and ethical clearance was given by the Tanzania National Institute for Medical Research. Analysis of de-identified samples was approved by the Institutional Review Board of the University of North Carolina, Chapel Hill (approval no. 19-1495).
During the survey, malaria detection was conducted by using CareStart Malaria Pf/PAN (HRP2/pLDH) Ag Combo RDTs (AccessBio, https://www.accessbio.net) that were specific for P. falciparum HRP2 and pan-pLDH antigens. RDTs were considered positive if they were positive for either antigen. Schools and councils were grouped into epidemiologic malaria transmission risk strata on the basis of P. falciparum prevalences in children estimated from the 2014–15 Tanzania SMPS (22,26). P. falciparum prevalence was defined as very low if <5%, low if 5 to <10%, moderate if 10 to <50%, and high if >50% (22,26). DBS samples collected on Whatman filter paper (Cytiva, https://www.cytivalifesciences.com) were shipped to the University of North Carolina (Chapel Hill, NC, USA) for molecular testing.
Molecular Detection
We extracted DNA from three 6-mm punches from each DBS sample by using a Chelex method (27) and performed real-time PCR targeting the 18S rRNA subunit of malaria as previously described (28) (Appendix Table 1). We performed PCR for each Plasmodium spp. independently with appropriate controls. We prepared positive controls for P. falciparum detection by using whole human blood and cultured P. falciparum strain 3D7 parasites (BEI Resources, https://www.beiresources.org) to create mock DBS samples and for nonfalciparum species detection by using plasmid DNA (BEI Resources). We serially diluted the control samples and extracted DNA as described. We estimated semiquantitative parasitemias for nonfalciparum species by assuming 6 18S rRNA gene copies/parasite (28) and multiplying by 4.0 to account for the 4-fold dilution of blood: ≈26 µL blood from 3 DBS punches (29) in 100 µL final volume of eluted DNA. We performed 40 PCR cycles for P. malariae and P. falciparum and 45 PCR cycles for P. ovale and P. vivax to enable detection of low-density infections (28). We previously validated this approach by using 390 negative controls comprising water (n = 22) and human DNA (n = 368) and >170 positive controls with decreasing nonfalciparum parasite densities; no false-positives were detected (28). We assessed PCR specificity by testing against 10 controls from each of the other Plasmodium spp.; no false positives were detected (Appendix Table 2). Our laboratory at the University of North Carolina participates in the World Health Organization malaria molecular quality assurance scheme, identifying and determining Plasmodium spp. in blinded samples every 6 months, and has consistently achieved high marks for assay performance across species. In this study, we did not detect false-positive amplification among 20 negative controls per each species-specific assay (Appendix Table 3). We performed further real-time PCR on a subset of P. ovale–positive samples to distinguish between P. ovale wallikeri and P. ovale curtisi (30,31). To evaluate potential bias from differences in PCR cycle numbers between species, we conducted a sensitivity analysis of randomly selected students (n = 750) stratified by malaria transmission risk. We performed semiquantitative real-time PCR of the 18S rRNA gene to 45 cycles to detect P. falciparum and P. malariae infections.
Analysis
We calculated overall malaria species-specific prevalences and prevalence of single- and mixed-species infections. We did not adjust prevalences for sampling weight because nonfalciparum samples were selected randomly and in equal proportion to the broader survey sample.
We performed descriptive statistical analyses of student characteristics according to Plasmodium spp. We analyzed differences between P. falciparum and nonfalciparum single-species infections by using Pearson χ2 and Kruskal-Wallis rank-sum tests assuming nonnormality and applied Fisher exact test for small frequency counts. We performed similar analyses to compare malaria-positive and -negative students according to Plasmodium spp. Missing data were summarized, but we performed analyses on nonmissing data only.
Spatial Mapping
We assessed regional variation in prevalence of each species through geospatial mapping by council and region. We aggregated numbers of infections and students by council and estimated and mapped council-level prevalences for each species. We calculated scaled prevalences by dividing the proportion of each council’s prevalence by the highest council prevalence for each Plasmodium species, as follows:

where P is the prevalence for a given council, di. We calculated and mapped differences between scaled nonfalciparum and scaled P. falciparum prevalences for each council. This method compared prevalence estimates between each nonfalciparum species and P. falciparum, while accounting for differences in the absolute burden of each species.
We performed analyses by using R version 4.0.2 (The R Project for Statistical Computing, https://www.r-project.org) and used the eulerr (https://cran-r-project.org/package=eulerr) and sf version 0.9–7 (32) packages for prevalence visualization and mapping. We sourced shapefiles from the Global Administrative Areas database (https://gadm.org) and collected elevation measurements from the US National Aeronautics and Space Administration, Shuttle Radar Topography Mission (https://www.nasa.gov).
Study Population
We selected a total of 3,456 students from 180 schools across 8 geographic regions for nonfalciparum malaria testing from among 17,131 students in the SMPS who had available DBS samples. We did not detect differences in student characteristics between those in the nonfalciparum malaria and SMPS DBS populations (Appendix Table 4). Median (interquartile range [IQR]) student age in the nonfalciparum study population was 11 (9–13) years; distribution of male (51%) and female (49%) students was similar. Malaria dual-antigen RDTs were positive in 20% of students. Most students attended schools in regions classified as high (51%) or moderate (13%) malaria transmission risk (Table 1).
Species Prevalence Determined by PCR
Figure 1
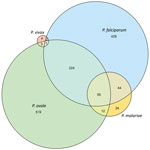
Figure 1. Distribution of Plasmodium spp. infections among schoolchildren, Tanzania. Prevalence estimates according to species: P. falciparum, 21.8% (95% CI 20.5%–23.3%, n = 755); P. ovale,...
We identified P. falciparum infections in 22% (95% CI 21%–23%, n = 755), P. ovale in 24% (95% CI 22%–25%, n = 814), P. malariae in 4% (95% CI 3%–5%, n = 136), and P. vivax in 0.3% (95% CI 0.2%–0.6%, n = 11) of students, including single- and mixed-species infections (Appendix Table 5). Most (64%, n = 519) P. ovale infections were single-species infections; 28% (n = 224) were co-infections with P. falciparum only (Figure 1). Conversely, most (40%, n = 55) P. malariae infections were co-infections with both P. ovale and P. falciparum; 32% (n = 44) were co-infections with P. falciparum only. We determined 36% (n = 4) of P. vivax infections were single-species infections, and 43% (n = 326) of P. falciparum infections were co-infections with >1 nonfalciparum malaria species.
We conducted a sensitivity analysis, detecting P. falciparum and P. malariae by using PCR cycle thresholds of <45 to evaluate different PCR cycles between assays. We observed 25% (95% CI 21%–29%) P. falciparum and 3% (95% CI 2%–5%) P. malariae prevalences, weighted according to student distribution within the total nonfalciparum population by transmission risk strata (Appendix Table 6). Within that subset, 2.5% (n = 4) of P. falciparum and 10% (n = 2) of P. malariae infections were detected at cycle thresholds of 40–45. Thus, >97% of P. falciparum and 90% of P. malariae infections were detectable by the primary 40-cycle assay in our study.
We evaluated differences in student characteristics according to Plasmodium spp. infection (Table 1; Appendix Table 7). We detected P. ovale single-species infections more frequently than P. falciparum infections in slightly younger (median 11 vs. 12 years of age; p<0.001) and female (54% vs. 45%; p = 0.009) students. Comparing RDT sensitivity to PCR, we observed 8% (n = 40) of students with P. ovale single-species infections were RDT-positive for any band, whereas 33% (n = 8) of those with P. malariae and 69% (n = 295) with P. falciparum single-species infections were RDT-positive. Co-infections with P. falciparum and nonfalciparum were RDT-positive in 78% (n = 253/325) of cases detected by PCR. Although only 3% (n = 13) of P. falciparum single-species infections and no P. malariae or P. vivax single-species infections were detected in low transmission risk strata, 35% (n = 181) of P. ovale single-species infections occurred in regions classified as low or very low malaria transmission risk. High epidemiologic risk strata harbored most single-species infections across all 4 Plasmodium spp. and also mixed infections with P. falciparum.
Parasite Density
Figure 2
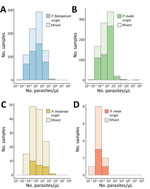
Figure 2. Estimated parasite density distributions according to malaria species in study of similar prevalence of Plasmodium falciparum and non–P. falciparum malaria infections among schoolchildren, Tanzania. We estimated ...
Malaria parasitemia estimated by semiquantitative PCR was low across nonfalciparum species (Figure 2). Median (IQR; min–max) P. ovale density was 7.2 (1.3–25.0; 0.1–168,596) parasites/µL, comparable to P. malariae density at 11.7 (2.7–54.9; 0.3–1,214) parasites/µL. P. vivax density was ≈0.6 (0.3–0.8; 0.1–8.1) parasites/µL. Although 18% (n = 25) of P. malariae infections had a parasite density >100 parasites/µL, we rarely observed that level for P. ovale (3%, n = 25) and never for P. vivax. P. falciparum density was also low at 13.1 (2.6–55.9; 0.1–8,248) parasites/µL; however, 17% (n = 132) of P. falciparum cases had a parasite density >100 parasites/µL, and 3% (n = 24) had >500 parasites/µL. Median (IQR) density among P. ovale mixed infections was 3.1 (1.2–11.4) parasites/µL and 13.5 (1.3–30.1) parasites/µL for P. ovale single-species infections (p<0.001), whereas densities were similar between single- and mixed-species infections among the other malaria species (Figure 2).
P. ovale Species Determination
Among 814 samples positive for P. ovale, 60 (7%) samples with the highest parasitemia were selected for PCR to distinguish between P. ovale wallikeri and P. ovale curtisi. Species determination by PCR was successful in 35% (n = 21) of samples; P. ovale curtisi was detected in 17 samples and P. ovale wallikeri in 9 samples. We identified P. ovale curtisi and P. ovale wallikeri co-infections in 5 students. We did not perform further characterization because of limited sample sizes.
Geographic Distribution
Figure 3
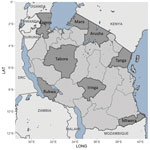
Figure 3. Locations of 8 survey regions within mainland Tanzania (dark gray shading) in study of similar prevalence of Plasmodium falciparum and non–P. falciparum malaria infections among schoolchildren, Tanzania....
Figure 4
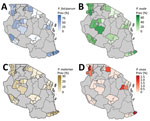
Figure 4. Spatial distribution of regional and school council–level malaria prevalence by species in study of similar prevalence of Plasmodium falciparum and non–P. falciparummalaria infections among schoolchildren, Tanzania....
We detected P. ovale across all 8 regions sampled in Tanzania, indicating widespread distribution (Table 2; Figures 3, 4). P. ovale prevalence was highest within the northern Kagera (34%, n = 273) and central Tabora (17%, n = 139) regions. We detected P. ovale curtisi infections in 6 of 8 regions (all but Arusha and Rukwa) and P. ovale wallikeri in 5 of 8 (Kagera, Mara, Tabora, Tanga, and Iringa) regions. We observed high prevalence of P. malariae in Kagera (29%, n = 39) and in southernmost Mtwara (28%, n = 38), and P. vivax was predominantly distributed along the northwestern borders of Tanzania in Kagera (55%, n = 6); select, isolated cases of P. vivax were also detected in southern and eastern regions. Arusha and Iringa did not have any cases of P. malariae or P. vivax infections and had the lowest frequencies of P. ovale (3%, n = 23, in Arusha; 4%, n = 30, in Iringa) and P. falciparum (0.4%, n = 3, in Arusha; 0.1%, n = 1, in Iringa) infections.
We detected malaria infections in students who were predominantly located at elevations <1,500 m, including 85% (n = 693) infected by P. ovale, 94% (n = 707) by P. falciparum, 95% (n = 129) by P. malariae, and 100% (n = 11) by P. vivax (Table 2). Most (77%, n = 2,667) students enrolled in our study were from schools located at elevations <1,500 m. Among students located at elevations >1,500, P. ovale infections were detected most frequently in 15% (n = 121) of students compared with 6% (n = 48) infected with P. falciparum, 1% (n = 7) infected with P. malariae, and 0% infected with P. vivax.
Figure 5
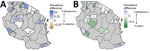
Figure 5. Differential scaled prevalences between Plasmodium malariae or P. ovale and P. falciparum at the school council level in study of similar prevalence of ...
We compared scaled prevalence estimates for nonfalciparum species with P. falciparum and identified areas where prevalences were higher than expected for P. ovale and P. malariae on the basis of P. falciparum frequency (Figure 5); P. vivax infections were too infrequent for comparison. In the southern and southwestern highlands and northwestern lake regions (Iringa, Rukwa, Tabora, and Kagera), scaled P. ovale prevalences were higher than P. falciparum prevalences. Scaled prevalence of P. malariae was notably higher than that of P. falciparum in the Karagwe council in Kagera and Mtwara municipal council in Mtwara. In most other areas, scaled prevalence of P. malariae was similar to or lower than P. falciparum prevalence.
Our study describes a large nationally representative molecular survey of nonfalciparum malaria epidemiology across Tanzania. We used real-time PCR to estimate nonfalciparum infection prevalences in school-aged children in 8 regions of the country selected to maintain geographic diversity and malaria transmission risk heterogeneity. One quarter (24%) of schoolchildren harbored P. ovale parasites, comparable to the 22% P. falciparum prevalence in the population, and 64% of P. ovale infections were single-species infections. P. malariae was observed in 4% of students, of which most were co-infected with other malaria species. P. vivax infections were rare (0.3% prevalence).
High P. ovale prevalence could be attributed to several factors. First, we increased the number of PCR cycles for P. ovale detection to 45 to enable detection of low-density infections, which comprised 91% of all P. ovale infections identified (Appendix Table 8). This approach has precedence (17,25,31), as low-density parasitemia is characteristic of P. ovale infections, making detection challenging. Using 40-cycle PCR for P. ovale yielded a 0.8% prevalence estimate in our previous work in the Democratic Republic of the Congo (5). The prevalence of P. ovale infections positive at <40 cycles in this study was 9% (n = 75), confirming most infections occurred at very low parasite densities. Second, many large-scale molecular surveys of nonfalciparum malaria have focused on adults or all-age cohorts, whereas school-aged children are increasingly recognized as the main contributors to asymptomatic and infectious malaria reservoirs (33–35). Finally, the high prevalence of P. ovale in our study might reflect increasing P. ovale transmission despite malaria control efforts targeting P. falciparum. Increasing or persistent transmission of P. ovale and P. malariae amid a P. falciparum decline has been observed in molecular surveys from Tanzania and nearby Kenya and Uganda, including in symptomatic cases (17,18,24,36). The causes of increased transmission are unclear but might include hypnozoite-induced relapses of P. ovale infections not treated by artemisinin-based combination therapies, insect day-biting, or outdoor vectors that evade bed nets.
In contrast to findings from other studies (11,36–39), we found that P. ovale infections occurred more commonly as single-species infections than did other nonfalciparum species infections, although increased sensitivity of P. ovale–specific PCR might partially explain those observations. P. ovale single-species infections were rarely detected by RDTs, rendering them more difficult to detect and treat. In addition, P. ovale single-species infections were largely the only infections identified within regions categorized as low risk for malaria transmission, suggesting an unexpected transmission risk in areas where prevention measures might be less common and P. falciparum risk is not a particular concern. Our scaled differential prevalence map similarly highlighted several councils where P. ovale and P. malariae prevalences were proportionally higher than expected on the basis of P. falciparum frequency. Taken together, those characteristics indicate a hidden burden of P. ovale infections in Tanzania.
Detection of P. vivax in this study is notable given the infection control challenges posed by this species. Infections were predominately detected in the northwest/Lake regions of Tanzania and in the east, where several other studies have also observed low P. vivax prevalences (4,24,40). P. malariae prevalence of 4% aligns with recent research in the region that also identified low infection prevalences (2.5% in Malawi, 4.1% in Democratic Republic of the Congo, and 3.3% symptomatic and 5.3% asymptomatic cases in western Kenya) (12,28,39). Estimated parasite densities were low across nonfalciparum species, as expected. P. falciparum parasite densities were also relatively low (median 13.1 parasites/µL), likely because of the predominantly asymptomatic population. In addition, mapping confirmed low or nonexistent prevalence of nonfalciparum malaria within the northern highlands of Arusha and southern highlands and midlands of Iringa.
The first limitation of our study is that using different PCR cycling times for different species introduces ascertainment bias. Because P. malariae and P. falciparum assays were run at 40 rather than 45 cycles, their relative prevalences compared with prevalence for P. ovale might be underestimated. However, we performed a sensitivity analysis to quantify this bias, which indicated that only an additional 2.5% of P. falciparum and 10% of P. malariae infections would be detected by using 45 cycles, suggesting minimal underestimation of reported P. falciparum and P. malariae prevalences and no meaningful effect on overall conclusions. Weighting sensitivity analysis results to the total study population yielded a P. falciparum prevalence of 25% if 45 cycles were used compared with the observed prevalence of 22%. Despite this result, prevalences could still be underestimated given lower probabilities of detecting very low density infections because of PCR limits of detection in concert with small volumes of template DNA used in the assays (2 µL for P. malariae, P. ovale, and P. falciparum; 5 µL for P. vivax). Second, our study did not sample all geographic regions in Tanzania, and findings cannot be extrapolated to other age groups with differing malaria risk profiles. School-based sampling likely underestimated prevalence of symptomatic or severe malaria infection in school-aged children because children might have been absent because of illness. Finally, the cross-sectional survey design revealed little about clinical implications of prevalent nonfalciparum infections, especially given substantial nonrandom missingness in fever data, or the extent to which infections represented chronic infection carriage versus transient parasitemia.
In conclusion, the overall high prevalence and broad geographic distribution of P. ovale and, to a lesser extent, P. malariae and the more focal distribution of P. vivax in this study underscore an urgent need to elucidate clinical prevalence and transmission patterns of those species to inform malaria control programs in Tanzania. Current treatment protocols in Tanzania do not regularly address hypnozoite liver-stage P. ovale infection, and relapses are expected after blood-stage clearance by artemisinin-based combination therapy (41). Accumulating evidence exists for increases in previously unappreciated nonfalciparum malaria infections in sub-Saharan Africa (38). Molecular detection methods, such as PCR, and new treatment strategies will be required for continued progress toward malaria control and elimination.
Ms. Sendor is a doctoral student at the University of North Carolina, Chapel Hill. Her research interests focus on malaria epidemiology.
Acknowledgments
We thank the 2017 SMPS study administrators and staff for their tireless work implementing the survey and students for participating in the study.
The following reagents were obtained through BEI Resources, National Institute of Allergy and Infectious Diseases, National Institutes of Health: diagnostic plasmids containing the small subunit 18S ribosomal RNA gene from Plasmodium malariae, MRA-179; Plasmodium ovale, MRA-180; and Plasmodium vivax, MRA-178, contributed by Peter A. Zimmerman; and Plasmodium falciparum, strain 3D7, MRA-102, contributed by Daniel J. Carucci.
This study was funded by the US National Institutes of Health (K24AI134990 and R01TW010870 to J.J.J.; T32AI070114 to C.L.M.; R21AI152260 to J.T.L.; R21AI148579 to J.T.L. and J.B.P.; R01AI139520 to J.B.P., R.S., and C.L.M.; and T32AI070114 to R.S.); Global Fund, which funded the survey; and US President's Malaria Initiative via the US Agency for International Development Okoa Maisha Dhibiti Malaria (cooperative agreement no. 72062118CA-00002) implemented by RTI International under the terms of an interagency agreement with the US Centers for Disease Control and Prevention for data management and facilitation of the initial processing and exporting of blood samples. Funding sources had no role in the study design, analysis, or writing of the manuscript.
The findings and conclusions in this report are those of the author(s) and do not necessarily represent the official position of the US Centers for Disease Control and Prevention, the President’s Malaria Initiative via the US Agency for International Development, or other employing organizations or sources of funding.
References
- World Health Organization. World malaria report 2021 [cited 2021 Dec 13]. https://www.who.int/teams/global-malaria-programme/reports/world-malaria-report-2021
- Alegana VA, Macharia PM, Muchiri S, Mumo E, Oyugi E, Kamau A, et al. Plasmodium falciparum parasite prevalence in East Africa: Updating data for malaria stratification. PLOS Glob Public Health. 2021;1:
e0000014 . DOIPubMedGoogle Scholar - Oriero EC, Amenga-Etego L, Ishengoma DS, Amambua-Ngwa A. Plasmodium malariae, current knowledge and future research opportunities on a neglected malaria parasite species. Crit Rev Microbiol. 2021;47:44–56. DOIPubMedGoogle Scholar
- Kim MJ, Jung BK, Chai JY, Eom KS, Yong TS, Min DY, et al. High malaria prevalence among schoolchildren on Kome Island, Tanzania. Korean J Parasitol. 2015;53:571–4. DOIPubMedGoogle Scholar
- Mitchell CL, Brazeau NF, Keeler C, Mwandagalirwa MK, Tshefu AK, Juliano JJ, et al. Under the radar: epidemiology of Plasmodium ovale in the Democratic Republic of the Congo. J Infect Dis. 2021;223:1005–14 . DOIPubMedGoogle Scholar
- Björkman A, Shakely D, Ali AS, Morris U, Mkali H, Abbas AK, et al. From high to low malaria transmission in Zanzibar-challenges and opportunities to achieve elimination. BMC Med. 2019;17:14. DOIPubMedGoogle Scholar
- Bousema JT, Drakeley CJ, Mens PF, Arens T, Houben R, Omar SA, et al. Increased Plasmodium falciparum gametocyte production in mixed infections with P. malariae. Am J Trop Med Hyg. 2008;78:442–8. DOIPubMedGoogle Scholar
- Sutherland CJ. Persistent parasitism: the adaptive biology of malariae and ovale malaria. Trends Parasitol. 2016;32:808–19. DOIPubMedGoogle Scholar
- World Health Organization. World malaria report 2020 [cited 2021 Aug 29]. https://www.who.int/publications-detail-redirect/9789240015791
- Langford S, Douglas NM, Lampah DA, Simpson JA, Kenangalem E, Sugiarto P, et al. Plasmodium malariae infection associated with a high burden of anemia: a hospital-based surveillance study. PLoS Negl Trop Dis. 2015;9:
e0004195 . DOIPubMedGoogle Scholar - Mueller I, Zimmerman PA, Reeder JC. Plasmodium malariae and Plasmodium ovale—the “bashful” malaria parasites. Trends Parasitol. 2007;23:278–83. DOIPubMedGoogle Scholar
- Lo E, Nguyen K, Nguyen J, Hemming-Schroeder E, Xu J, Etemesi H, et al. Plasmodium malariae prevalence and csp gene diversity, Kenya, 2014 and 2015. Emerg Infect Dis. 2017;23:601–10. DOIPubMedGoogle Scholar
- Twohig KA, Pfeffer DA, Baird JK, Price RN, Zimmerman PA, Hay SI, et al. Growing evidence of Plasmodium vivax across malaria-endemic Africa. PLoS Negl Trop Dis. 2019;13:
e0007140 . DOIPubMedGoogle Scholar - Howes RE, Battle KE, Mendis KN, Smith DL, Cibulskis RE, Baird JK, et al. Global epidemiology of Plasmodium vivax. Am J Trop Med Hyg. 2016;95(Suppl):15–34. DOIPubMedGoogle Scholar
- Price RN, Commons RJ, Battle KE, Thriemer K, Mendis K. Plasmodium vivax in the era of the shrinking P. falciparum map. Trends Parasitol. 2020;36:560–70. DOIPubMedGoogle Scholar
- Groger M, Fischer HS, Veletzky L, Lalremruata A, Ramharter M. A systematic review of the clinical presentation, treatment and relapse characteristics of human Plasmodium ovale malaria. Malar J. 2017;16:112. DOIPubMedGoogle Scholar
- Akala HM, Watson OJ, Mitei KK, Juma DW, Verity R, Ingasia LA, et al. Plasmodium interspecies interactions during a period of increasing prevalence of Plasmodium ovale in symptomatic individuals seeking treatment: an observational study. Lancet Microbe. 2021;2:e141–50. DOIPubMedGoogle Scholar
- Yman V, Wandell G, Mutemi DD, Miglar A, Asghar M, Hammar U, et al. Persistent transmission of Plasmodium malariae and Plasmodium ovale species in an area of declining Plasmodium falciparum transmission in eastern Tanzania. PLoS Negl Trop Dis. 2019;13:
e0007414 . DOIPubMedGoogle Scholar - Doctor SM, Liu Y, Anderson OG, Whitesell AN, Mwandagalirwa MK, Muwonga J, et al. Low prevalence of Plasmodium malariae and Plasmodium ovale mono-infections among children in the Democratic Republic of the Congo: a population-based, cross-sectional study. Malar J. 2016;15:350. DOIPubMedGoogle Scholar
- Taylor SM, Messina JP, Hand CC, Juliano JJ, Muwonga J, Tshefu AK, et al. Molecular malaria epidemiology: mapping and burden estimates for the Democratic Republic of the Congo, 2007. PLoS One. 2011;6:
e16420 . DOIPubMedGoogle Scholar - US Agency for International Development. US President’s Malaria Initiative. Tanzania malaria operational plan FY 2015 [cited 2021 Aug 30]. https://d1u4sg1s9ptc4z.cloudfront.net/uploads/2021/03/fy-2015-tanzania-malaria-operational-plan.pdf
- Chacky F, Runge M, Rumisha SF, Machafuko P, Chaki P, Massaga JJ, et al. Nationwide school malaria parasitaemia survey in public primary schools, the United Republic of Tanzania. Malar J. 2018;17:452. DOIPubMedGoogle Scholar
- Tanzania Ministry of Health, Community Development, Gender, Elderly and Children. Ministry of Health Zanzibar; National Bureau of Statistics and Office of the Chief Government Statistician Zanzibar; ICF USA. Tanzania malaria indicator survey 2017 [cited 2021 Aug 30]. https://dhsprogram.com/pubs/pdf/MIS31/MIS31.pdf
- Cook J, Xu W, Msellem M, Vonk M, Bergström B, Gosling R, et al. Mass screening and treatment on the basis of results of a Plasmodium falciparum-specific rapid diagnostic test did not reduce malaria incidence in Zanzibar. J Infect Dis. 2015;211:1476–83. DOIPubMedGoogle Scholar
- Tarimo BB, Nyasembe VO, Ngasala B, Basham C, Rutagi IJ, Muller M, et al. Seasonality and transmissibility of Plasmodium ovale in Bagamoyo District, Tanzania. Parasit Vectors. 2022;15:56. DOIPubMedGoogle Scholar
- Mitchell CL, Ngasala B, Janko MM, Chacky F, Edwards JK, Pence BW, et al. Evaluating malaria prevalence and land cover across varying transmission intensity in Tanzania using a cross-sectional survey of school-aged children. Malar J. 2022;21:80. DOIPubMedGoogle Scholar
- Teyssier NB, Chen A, Duarte EM, Sit R, Greenhouse B, Tessema SK. Optimization of whole-genome sequencing of Plasmodium falciparum from low-density dried blood spot samples. Malar J. 2021;20:116. DOIPubMedGoogle Scholar
- Gumbo A, Topazian HM, Mwanza A, Mitchell CL, Puerto-Meredith S, Njiko R, et al. Occurrence and distribution of nonfalciparum malaria parasite species among adolescents and adults in Malawi. J Infect Dis. 2022;225:257–68. DOIPubMedGoogle Scholar
- Hewawasam E, Liu G, Jeffery DW, Gibson RA, Muhlhausler BS. Estimation of the volume of blood in a small disc punched from a dried blood spot card. Eur J Lipid Sci Technol. 2018;120:
1700362 . DOIGoogle Scholar - Perandin F, Manca N, Calderaro A, Piccolo G, Galati L, Ricci L, et al. Development of a real-time PCR assay for detection of Plasmodium falciparum, Plasmodium vivax, and Plasmodium ovale for routine clinical diagnosis. J Clin Microbiol. 2004;42:1214–9. DOIPubMedGoogle Scholar
- Calderaro A, Piccolo G, Gorrini C, Montecchini S, Rossi S, Medici MC, et al. A new real-time PCR for the detection of Plasmodium ovale wallikeri. PLoS One. 2012;7:
e48033 . DOIPubMedGoogle Scholar - Pebesma E. Simple features for R: standardized support for spatial vector data. R J. 2018;10:439–46. DOIGoogle Scholar
- Abdulraheem MA, Ernest M, Ugwuanyi I, Abkallo HM, Nishikawa S, Adeleke M, et al. High prevalence of Plasmodium malariae and Plasmodium ovale in co-infections with Plasmodium falciparum in asymptomatic malaria parasite carriers in southwestern Nigeria. Int J Parasitol. 2022;52:23–33. DOIPubMedGoogle Scholar
- Andolina C, Rek JC, Briggs J, Okoth J, Musiime A, Ramjith J, et al. Sources of persistent malaria transmission in a setting with effective malaria control in eastern Uganda: a longitudinal, observational cohort study. Lancet Infect Dis. 2021;21:1568–78. DOIPubMedGoogle Scholar
- Walldorf JA, Cohee LM, Coalson JE, Bauleni A, Nkanaunena K, Kapito-Tembo A, et al. School-age children are a reservoir of malaria infection in Malawi. PLoS One. 2015;10:
e0134061 . DOIPubMedGoogle Scholar - Betson M, Clifford S, Stanton M, Kabatereine NB, Stothard JR. Emergence of nonfalciparum Plasmodium infection despite regular artemisinin combination therapy in an 18-month longitudinal study of Ugandan children and their mothers. J Infect Dis. 2018;217:1099–109. DOIPubMedGoogle Scholar
- Bruce MC, Macheso A, Kelly-Hope LA, Nkhoma S, McConnachie A, Molyneux ME. Effect of transmission setting and mixed species infections on clinical measures of malaria in Malawi. PLoS One. 2008;3:
e2775 . DOIPubMedGoogle Scholar - Hawadak J, Dongang Nana RR, Singh V. Global trend of Plasmodium malariae and Plasmodium ovale spp. malaria infections in the last two decades (2000-2020): a systematic review and meta-analysis. Parasit Vectors. 2021;14:297. DOIPubMedGoogle Scholar
- Parr JB, Kieto E, Phanzu F, Mansiangi P, Mwandagalirwa K, Mvuama N, et al. Analysis of false-negative rapid diagnostic tests for symptomatic malaria in the Democratic Republic of the Congo. Sci Rep. 2021;11:6495. DOIPubMedGoogle Scholar
- Baltzell KA, Shakely D, Hsiang M, Kemere J, Ali AS, Björkman A, et al. Prevalence of PCR detectable malaria infection among febrile patients with a negative Plasmodium falciparum specific rapid diagnostic test in Zanzibar. Am J Trop Med Hyg. 2013;88:289–91. DOIPubMedGoogle Scholar
- Groger M, Veletzky L, Lalremruata A, Cattaneo C, Mischlinger J, Manego Zoleko R, et al. Prospective clinical and molecular evaluation of potential Plasmodium ovale curtisi and wallikeri relapses in a high-transmission setting. Clin Infect Dis. 2019;69:2119–26. DOIPubMedGoogle Scholar
Figures
Tables
Cite This ArticleOriginal Publication Date: April 24, 2023
1Data from this study were presented as a virtual poster at the American Society of Tropical Medicine and Hygiene conference, November 17–21, 2021.
2These first authors contributed equally to this article.
3These senior authors contributed equally to this article.
Table of Contents – Volume 29, Number 6—June 2023
| EID Search Options |
|---|
|
|
|
|
|
|
Please use the form below to submit correspondence to the authors or contact them at the following address:
Jonathan Juliano, University of North Carolina at Chapel Hill, 111 Mason Farm Rd, 2340B, MBRB, CB#7036, Chapel Hill, NC 27713, USA
Top