Volume 29, Number 7—July 2023
Research Letter
Novel Highly Pathogenic Avian Influenza A(H5N1) Clade 2.3.4.4b Virus in Wild Birds, South Korea
Figure 1
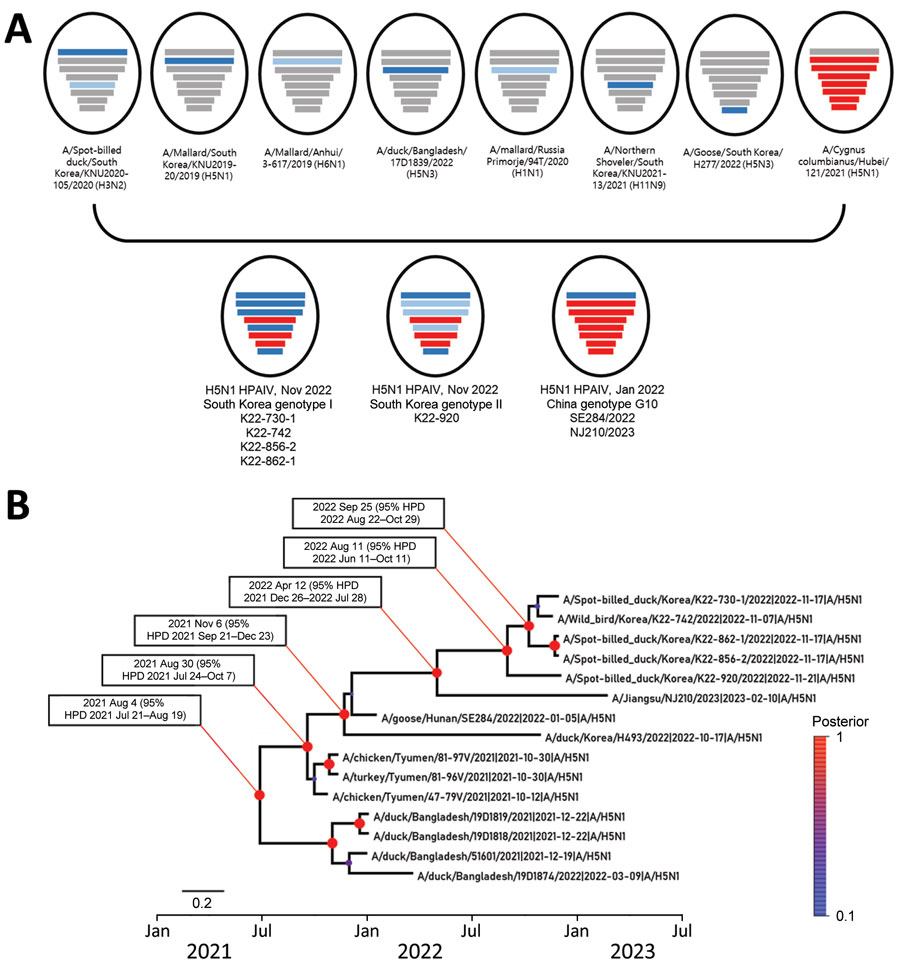
Figure 1. Phylogenetic analysis of novel highly pathogenic avian influenza A(H5N1) clade 2.3.4.4b viruses found in wild bird feces in South Korea, November 2022. A) Schematic representation of origin of virus isolates from South Korea compared with genotype G10 viruses found in China. Bars represent 8 gene segments of avian influenza virus in the following order (top to bottom): polymerase basic 2, polymerase basic 1, polymerase acidic, hemagglutinin, nucleoprotein, neuraminidase, matrix, and nonstructural. Different bar colors indicate different virus origins estimated from maximum-likelihood phylogenetic trees. Gene segments originating from highly pathogenic avian influenza viruses are indicated by red bars. Gene segments originating from low pathogenicity avian influenza viruses are indicated by blue bars. B) Time-scaled maximum clade credibility tree for hemagglutinin gene segments from novel viruses isolated in South Korea (5 viruses at top). Red to blue colored scale on right side indicates posterior clade probabilities at nodes. Scale bar indicates nucleotide substitutions per site. HPD, highest posterior density.