Volume 29, Number 7—July 2023
Research
Trajectory and Demographic Correlates of Antibodies to SARS-CoV-2 Nucleocapsid in Recently Infected Blood Donors, United States
Figure 1
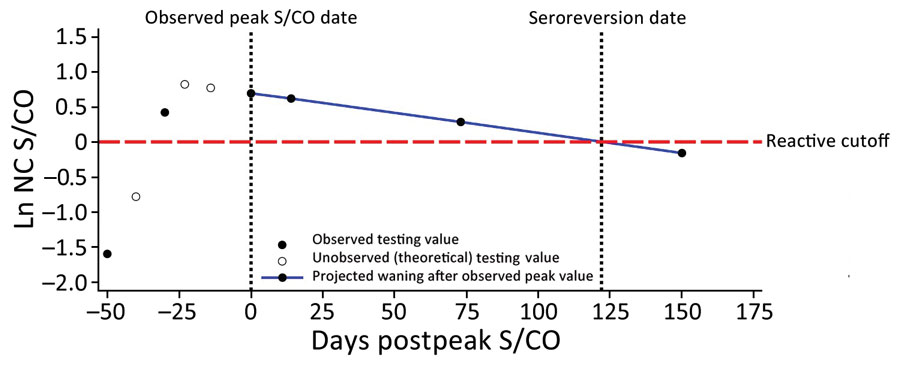
Figure 1. Potential nucleocapsid antibody test signal over time, showing likely sequence of S/CO values and seroconversion and seroreversion for nucleocapsid antibodies, in study of trajectory and demographic correlates of antibodies to SARS-CoV-2 nucleocapsid in recently infected blood donors, United States, June 2020‒June 2021. Each circle shows a potential value; solid circles indicate observed testing values and open circles theoretical unobserved points. The observed peak value is likely to be less that the true peak value and could occur before the true peak, in which case the slope could be affected. Blue line indicates the projected waning after the observed peak value. Ln, natural log; NC, nucleocapsid; S/CO, signal-to-cutoff value.