Volume 29, Number 7—July 2023
Research
Trajectory and Demographic Correlates of Antibodies to SARS-CoV-2 Nucleocapsid in Recently Infected Blood Donors, United States
James M. Haynes, Roger Y. Dodd, Lauren A. Crowder, Edward P. Notari, and Susan L. Stramer
Figure 4
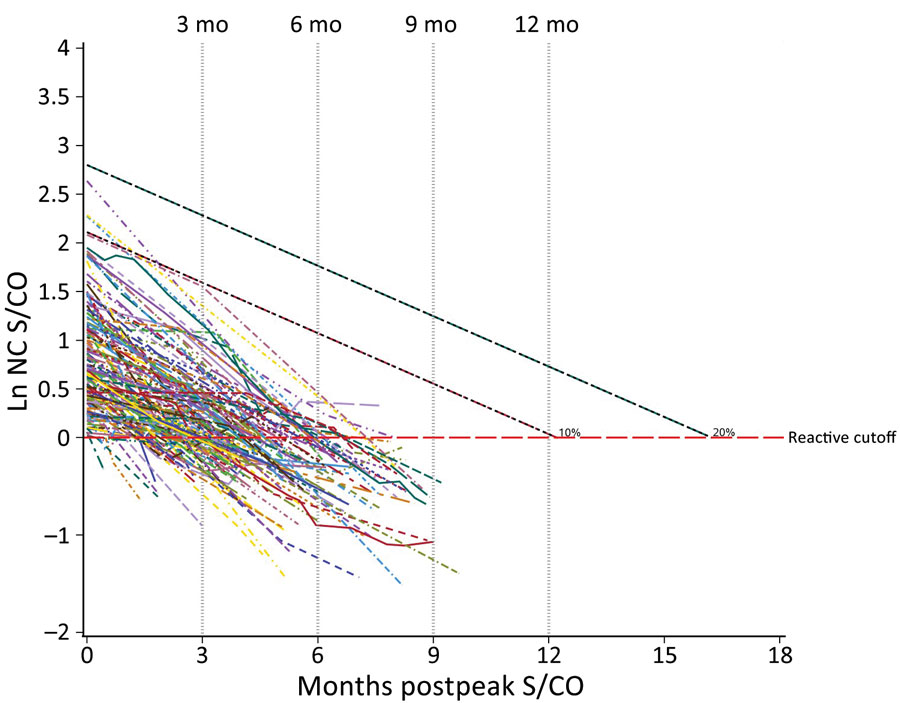
Figure 4. Longitudinal plot of nucleocapsid reactive seroreverting donors in study of trajectory and demographic correlates of antibodies to SARS-CoV-2 nucleocapsid in recently infected blood donors, United States, June 2020‒June 2021. All seroreverting donors are plotted by their observed testing values. Black dashed lines are overlaid as indicators of the first and second deciles of peak S/COs across all donors to show low starting values of those who seroreverted. Decile lines are plotted by using the mean age (52 years) of donors, but seroreverting donors were slightly younger (49 years) and showed faster waning. Ln, natural log; NC, nucleocapsid; S/CO, signal-to-cutoff value.
Page created: April 29, 2023
Page updated: June 20, 2023
Page reviewed: June 20, 2023
The conclusions, findings, and opinions expressed by authors contributing to this journal do not necessarily reflect the official position of the U.S. Department of Health and Human Services, the Public Health Service, the Centers for Disease Control and Prevention, or the authors' affiliated institutions. Use of trade names is for identification only and does not imply endorsement by any of the groups named above.