Skip directly to site content Skip directly to page options Skip directly to A-Z link Skip directly to A-Z link Skip directly to A-Z link
Volume 30, Number 12—December 2024
Online Report

Operational Risk Assessment Tool for Evaluating Leishmania infantum Introduction and Establishment in the United States through Dog Importation1

David R. Marquez2Comments to Author , Anne Straily2, Keeve Nachman, Douglas E. Norris, Meghan F. Davis3, and Christine A. Petersen3
Author affiliation: US Army Veterinary Services, Aberdeen Proving Ground, Maryland, USA (D.R. Marquez); Johns Hopkins University, Baltimore, Maryland, USA (D.R. Marquez, K. Nachman, D.E. Norris, M.F. Davis); Centers for Disease Control and Prevention, Atlanta, Georgia, USA (A. Straily); University of Iowa, Iowa City, Iowa, USA (C.A. Petersen)

Main Article

Figure 7

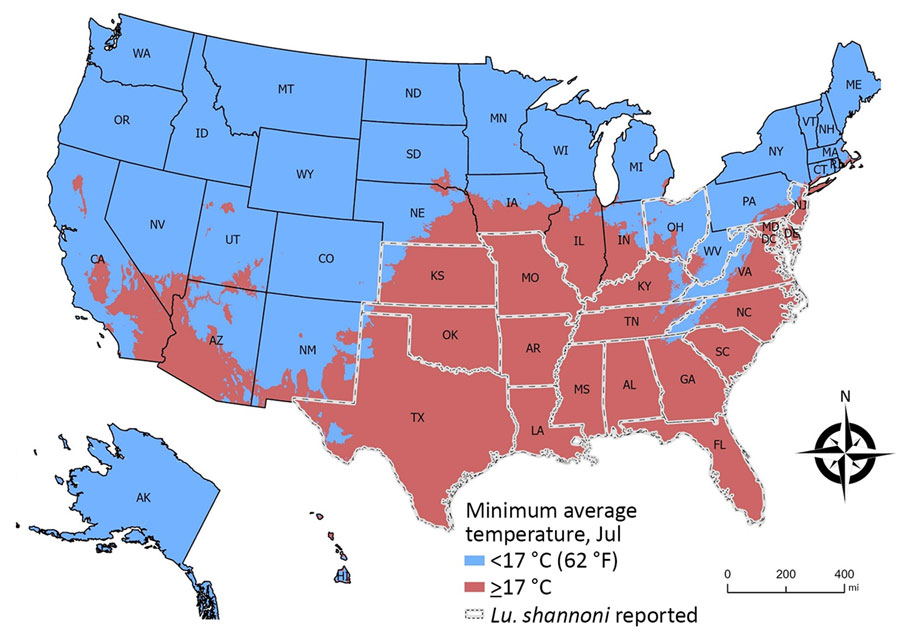
Minimum average July temperatures used to develop an operational risk assessment tool for evaluating Leishmania infantum introduction and establishment in the United States through dog importation. Map shows areas in the United States where Lutzomyia shannoni sand flies have been reported (white dotted lines); Lu. shannoni sand flies could serve as L. infantum vectors. Map created with ArcGIS Pro 3.0.2 (Esri, https://www.esri.com) by using NAD 1983 Contiguous USA Albers Projection. Climate data from Worldclim Version 2 (https://worldclim.org) includes average July minimum temperatures during 1970–2000 at 1 km2 spatial resolution (Appendix reference 99).

Figure 7. Minimum average July temperatures used to develop an operational risk assessment tool for evaluating Leishmania infantum introduction and establishment in the United States through dog importation. Map shows areas in the United States where Lutzomyia shannoni sand flies have been reported (white dotted lines); Lu. shannoni sand flies could serve as L. infantum vectors. Map created with ArcGIS Pro 3.0.2 (Esri, https://www.esri.com) by using NAD 1983 Contiguous USA Albers Projection. Climate data from Worldclim Version 2 (https://worldclim.org) includes average July minimum temperatures during 1970–2000 at 1 km2 spatial resolution (Appendix reference 99).

Main Article

1Preliminary results from this study were presented at the American Society for Tropical Medicine and Hygiene Annual Meeting; October 18–22, 2023; Chicago, Illinois, USA.

2These first authors contributed equally to this article.

3These senior authors contributed equally to this article.

Page created: October 18, 2024
Page updated: November 26, 2024
Page reviewed: November 26, 2024
The conclusions, findings, and opinions expressed by authors contributing to this journal do not necessarily reflect the official position of the U.S. Department of Health and Human Services, the Public Health Service, the Centers for Disease Control and Prevention, or the authors' affiliated institutions. Use of trade names is for identification only and does not imply endorsement by any of the groups named above.
file_external