Volume 30, Number 6—June 2024
Dispatch
Evolution and Antigenic Differentiation of Avian Influenza A(H7N9) Virus, China
Figure 2
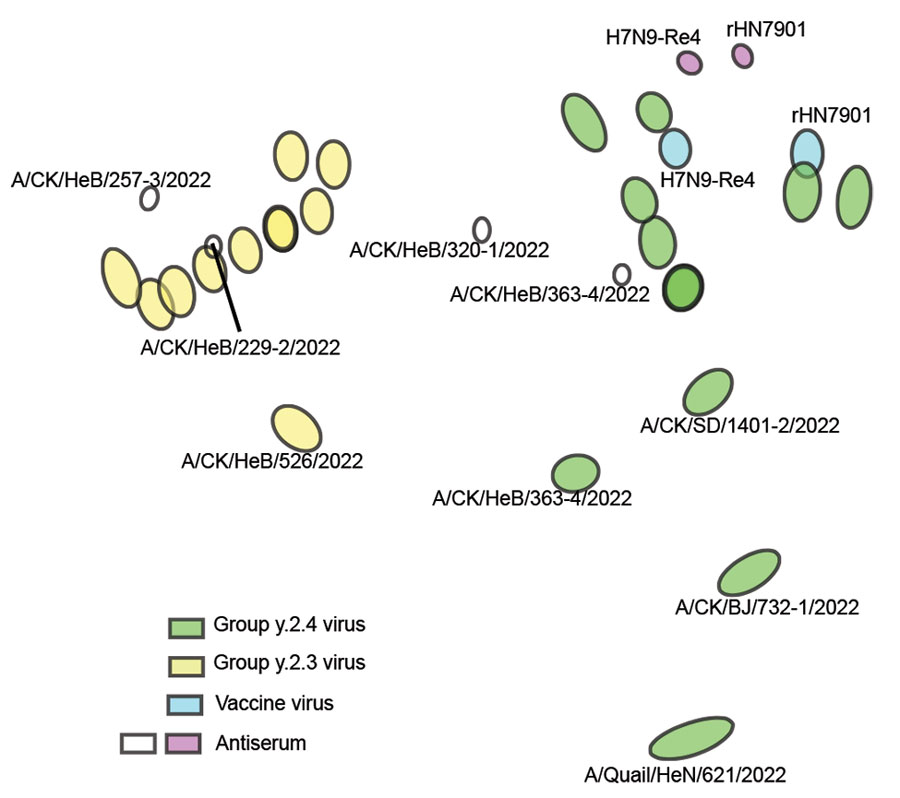
Figure 2. Antigenic map of avian influenza A(H7N9) virus, China, 2021–2023. The map was plotted using hemagglutinin inhibition assay results of 26 antigens (green, blue, and yellow dots), serum from 2 vaccine virus strains, H7N9-Re4 and rHN7901 (purple dots), and in-house designed serum of 4 circulating viruses (CK for chicken). The antigen map was constructed using the online website of the Antigenic Cartography Group, University of Cambridge (https://acmacs-web.antigenic-cartography.org). A/Chicken/HeB/257-3/2022 and A/Chicken/HeB/229-2/2022 belong to the Group.y.2.3 branch, whereas A/Chicken/HeB/320-1/2022 and A/Chicken/HeB/363-4/2022 belong to the Group.y.2.4 branch (indicated by white dots). The distance between the figures represents the antigen distance.
1These first authors contributed equally to this article.