Skip directly to site content Skip directly to page options Skip directly to A-Z link Skip directly to A-Z link Skip directly to A-Z link
Volume 30, Number 6—June 2024
Research

SARS-CoV-2 Disease Severity and Cycle Threshold Values in Children Infected during Pre-Delta, Delta, and Omicron Periods, Colorado, USA, 2021–2022

Laura BankersComments to Author , Shannon C. O’Brien, Diana M. Tapay, Erin Ho, Isaac Armistead, Alexis Burakoff, Samuel R. Dominguez, and Shannon R. Matzinger
Author affiliations: Colorado Department of Public Health and Environment, Denver, Colorado, USA (L. Bankers, S.C. O’Brien, D.M. Tapay, I. Armistead, A. Burakoff, S.R. Matzinger); University of Colorado, Aurora, Colorado, USA (E. Ho, S.R. Dominguez); Children’s Hospital Colorado, Aurora (E. Ho, S.R. Dominguez)

Main Article

Figure 3

Ct value patterns of patient characteristics across variant periods in study of SARS-CoV-2 disease severity in children during pre-Delta, Delta, and Omicron periods, Colorado, USA, January 2021–January 2022. Boxplots indicate overall Ct value patterns among patient characteristics across variant periods. A) Variant period; B) age group; C) vaccination status (unvaccinated vs. vaccinated with any number of doses); D) vaccination status (unvaccinated vs. vaccinated by number of doses). Red = pre-Delta, Blue = Delta, Orange = Omicron. Significance was determined using 1-way analysis of variance (A) or 2-way (B–D) with Tukey test. Brackets indicate which comparisons correspond to the significance codes, and connected brackets indicate comparisons that have the same significance code. Ct, cycle threshold.

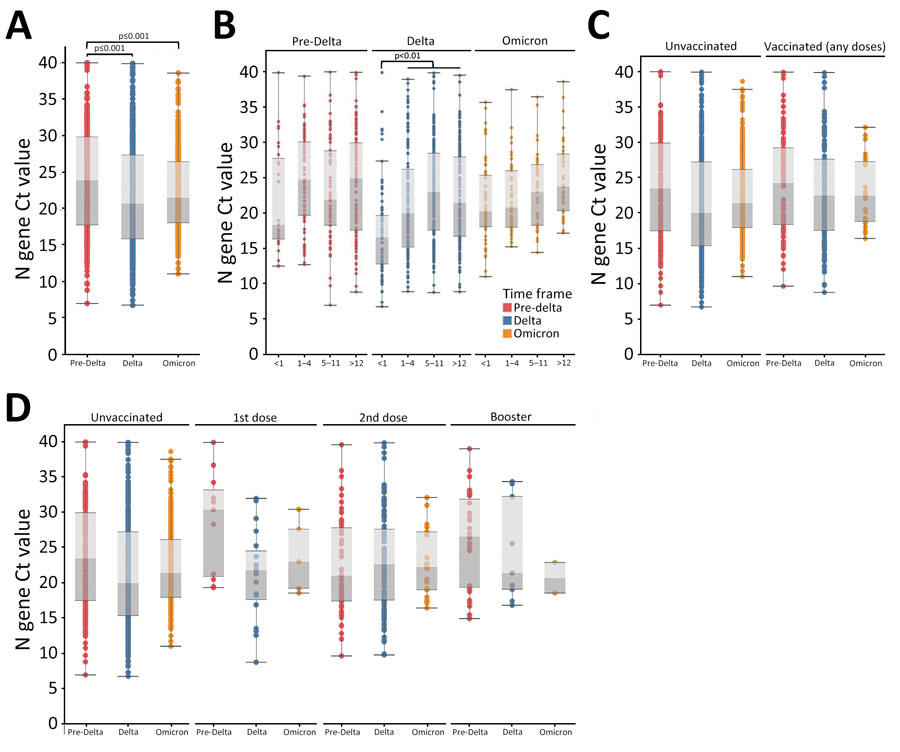
Figure 3. Ct value patterns of patient characteristics across variant periods in study of SARS-CoV-2 disease severity in children during pre-Delta, Delta, and Omicron periods, Colorado, USA, January 2021–January 2022. Boxplots indicate overall Ct value patterns among patient characteristics across variant periods. A) Variant period; B) age group; C) vaccination status (unvaccinated vs. vaccinated with any number of doses); D) vaccination status (unvaccinated vs. vaccinated by number of doses). Red = pre-Delta, Blue = Delta, Orange = Omicron. Significance was determined using 1-way analysis of variance (A) or 2-way (B–D) with Tukey test. Brackets indicate which comparisons correspond to the significance codes, and connected brackets indicate comparisons that have the same significance code. Ct, cycle threshold.

Main Article

Page created: April 08, 2024
Page updated: May 22, 2024
Page reviewed: May 22, 2024
The conclusions, findings, and opinions expressed by authors contributing to this journal do not necessarily reflect the official position of the U.S. Department of Health and Human Services, the Public Health Service, the Centers for Disease Control and Prevention, or the authors' affiliated institutions. Use of trade names is for identification only and does not imply endorsement by any of the groups named above.
file_external