Volume 30, Number 8—August 2024
Research Letter
Persistence of Influenza H5N1 and H1N1 Viruses in Unpasteurized Milk on Milking Unit Surfaces
Figure 2
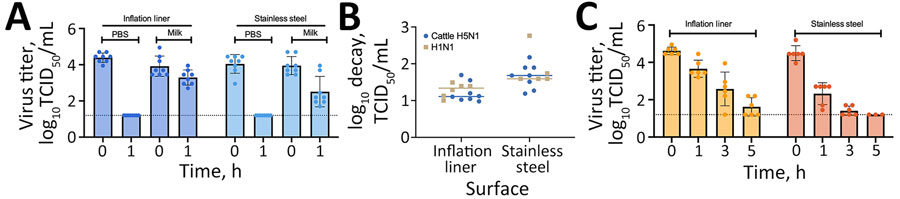
Figure 2. Viral titers in a study of persistence of influenza H5N1 and H1N1 viruses in unpasteurized milk on milking unit surfaces. A) Viral titers of bovine A(H5N1) virus diluted 1:10 in unpasteurized milk or PBS and deposited as ten 1-μL droplets onto the indicated surfaces. Droplets were recovered immediately after deposition (time 0) or after 1 hour of aging at 70% relative humidity (RH) at 21°C. Colored dots indicate measurements for each droplet; error bars indicate SD. Horizontal dotted lines indicate the theoretical limits of detection. B) Comparison of log decay values of H5N1 and H1N1 viruses in unpasteurized milk at 70% RH for 1 hour on rubber inflation liners and stainless steel. Decay was calculated as a ratio of the viral titer at time 0 divided by the titer after 1 hour. Colored symbols indicate measurements for each droplet. Horizonal lines indicate median values. C) Viral titers of the H1N1 virus diluted 1:10 in unpasteurized milk on the 2 surfaces at 70% RH for 0, 1, 3, or 5 hours at 23.6°C–25°C. Each symbol is a replicate of >2 biologic replicates using 2 distinct lots of unpasteurized milk performed in triplicate. Virus titer was calculated using the traditional TCID50 assay on MDCK cells. Colored dots indicate measurements for each droplet; error bars indicate SD. Horizontal dotted lines indicate the theoretical limits of detection. All raw data are available at https://doi.org/10.6084/m9.figshare.c.7242034.v1. PBS, phosphate buffered saline; TCID50, 50% tissue culture infectious dose.
1These first authors contributed equally to this article.